Go, Go, Gadget!
Raspberry Pi Weather Stations for the Absolute Beginner


Christina Kampel
Digital Engineering Fellowship, Spring 2022
University of Calgary
Contact Me!
- GitHub: Christina-Kampel
- Email: cekampel@gmail.com
Code for this blog post can be found here.
Project Scope
Project Goals
- Gain a better understanding of computer hardware by using a Raspberry Pi 4.
- Learn methods of collecting data using electronic sensors.
- Compare temperature and humidity data from several different sensors.
- Implement a web application to express data in a clear and meaningful way.

Procedure
- Initialize Raspberry Pi 4 with Raspbian OS. Connect to mouse, keyboard and monitor.
- Connect temperature-humidity sensors to Raspberry Pi 4:
- DHT11
- Grove Begin and test data collection.
- Generate graphs using collected data. Compare temperature and humidity data across both sensors.
- Display data on webpage accessible from within the University of Calgary network.
Making Learning Whole Paradigm
This project focuses on Principle 1 from Making Learning Whole: How Seven Principles of Teaching Can Transform Education: Play the Whole Game
What Does This Mean?
- Students already have most of the skills needed to complete the project
- This project will demonstrate a practical application of coding skills, instead of a theoretical application
- Students can complete the project feeling more confident about their ability to apply theoretical skills to a real-life problem
Connecting Concepts

FAQ
Q: How can this project be applied to Digital Engineering curriculum?
A: This work can be used as a project or large-scale assignment for Digital Engineering students.
Q: Who should do this project?
A: Students with proficient knowledge in Python and some experience with Matplotlib, Flask and HTML.
Q: Why should I do this project?
A: One of the best ways to learn is by doing. You will boost your self-confidence by proving to yourself that you can use what you already know to make something new and useful. You may be surprised what you learn along the way. Remember: No matter how hard the project seems, there is light at the end of the tunnel!
Phase 1: Initializing the Raspberry Pi
You will need:
- A computer
- A microSD adapter (if your computer does not have a microSD port)
- Internet access
- A microSD card (preferably 32 GB or less)
- A Raspberry Pi 4 Model B
- A USB-C power cable (with an on/off switch is best)
- A Mouse with USB Cable
- A Keyboard with USB Cable
- A Monitor
- A Micro HDMI Cable or Adapter
Estimated Time Required: 2-3 Hours
1.1: A Brief Introduction
In Phase 1 we need to get the Raspberry Pi 4 up and running. Unlike the computers in your phone, laptop or smartwatch, Raspberry Pi computers do not come with a built-in Operating System (OS). This means you need to do it yourself, by putting the OS on a microSD card using your own computer and then inserting the microSD into the Raspberry Pi.
There are several ways to do this. For a Raspberry Pi 4, you can use the New Out of Box Software (NOOBS) method, or the Raspberry Pi Imager method. We will be using the latter.
It is important to have some sort of an adapter for your microSD card, since most laptops or computers do not have that kind of port. Some options are a microSD to USB adapter or a microSD to SD card adapter. The important part is that you have some way of connecting the microSD to your computer. I am using an ADATA microReader, because it is what I had on hand.
The content in Sections 1.1 to 1.5 is based on the video The New Method to Setup Raspberry Pi (2022 Update) by Refactored on YouTube (https://www.youtube.com/watch?v=jRKgEXiMtns).
1.2: Checking the File Format
Raspberry Pi’s require your microSD card to be in FAT32 file format. This is the default format for SD cards with 32GB or less storage capacity.
If your microSD card is 32GB or less, congratulations! You can move on to section 1.3.
If your microSD card is greater than 32GB, you will need to convert it to FAT32. Both Windows and Mac have options for this that can be found with a simple Google search. Once this is completed, move on to section 1.3.
1.3: Flashing the microSD Card
In the Raspberry Pi world, "flashing the SD card" means writing the OS image to the SD card. We will be doing this using Raspberry Pi Imager to install the Raspberry Pi OS (formerly Raspbian).
Follow these steps:
Step 1: Go to the official Raspberry Pi website: https://www.raspberrypi.org/
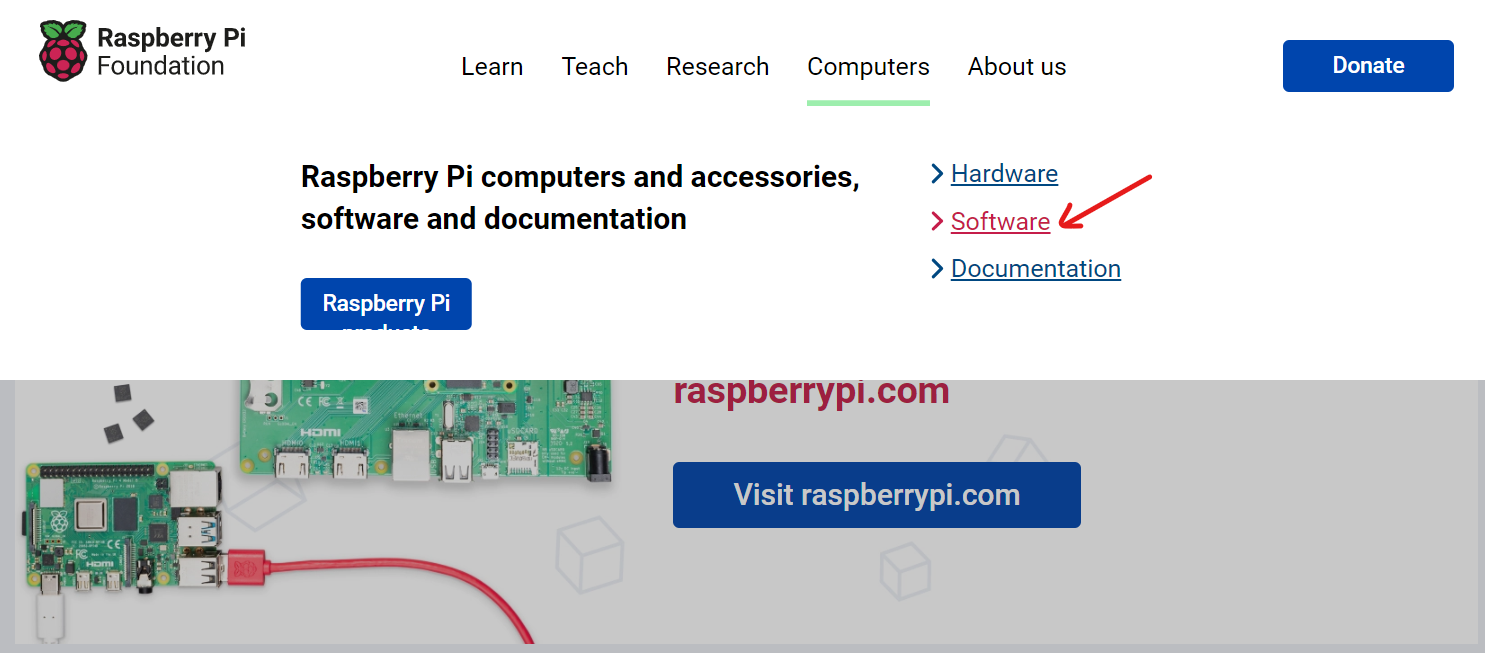
Step 2: Navigate to the Software page. It should be under Computers > Software.
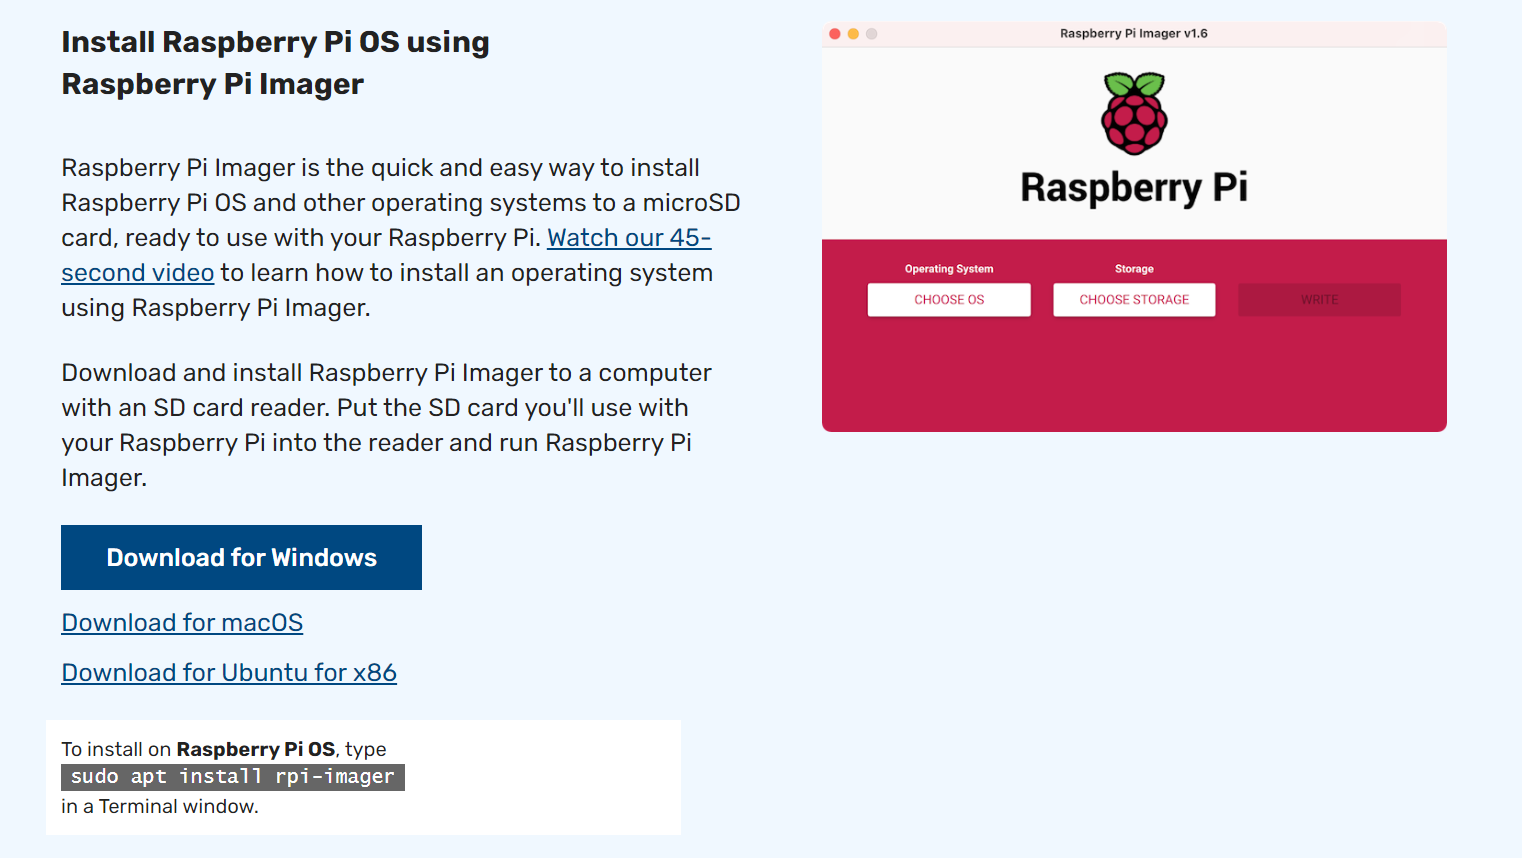
Step 3: Under "Install Raspberry Pi OS using Raspberry Pi Imager", download the version that works on your computer (Windows, macOS or Ubuntu). I'm using the Windows option.
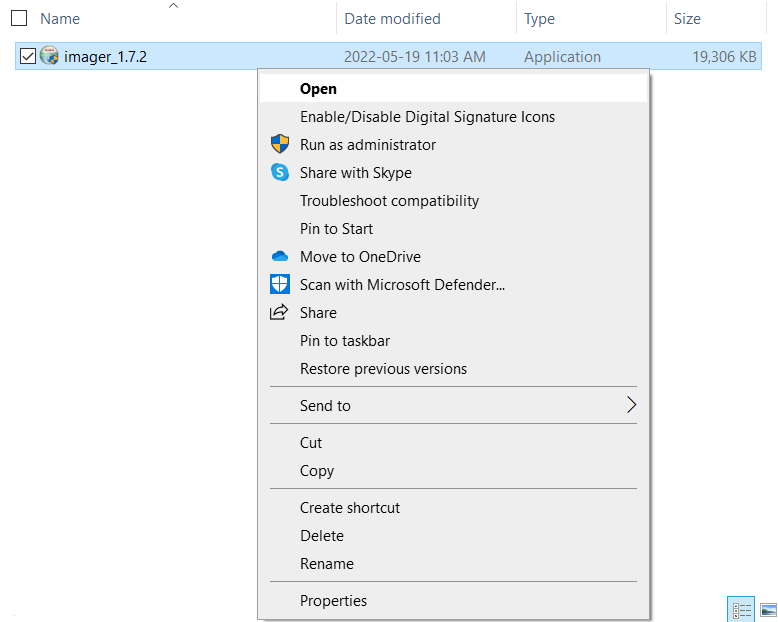
Step 4: Find the downloaded file in your File Explorer (or Finder on Mac) and open it. If it asks if you want to allow it to make changes to your device, click Yes.
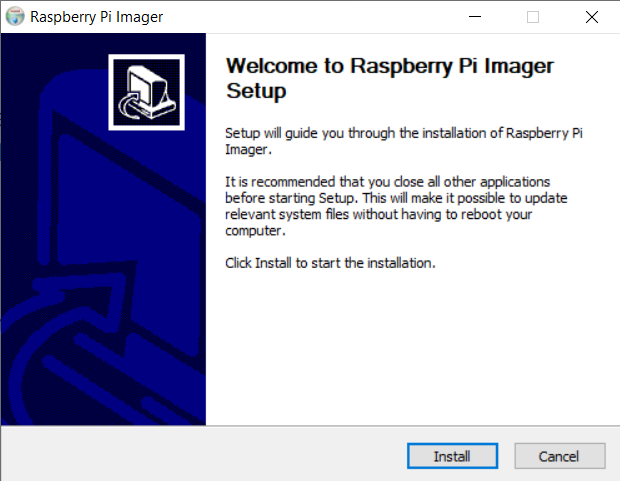
Step 5: When the Raspberry Pi Imager pop-up window appears, click Install. You may want to close all other applications that are currently running on your computer.
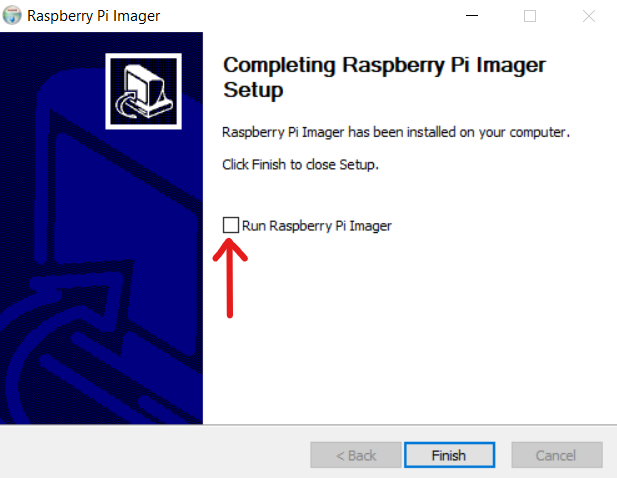
Step 6: When the Installation is complete, uncheck the "Run Raspberry Pi Imager" button and click Finish.
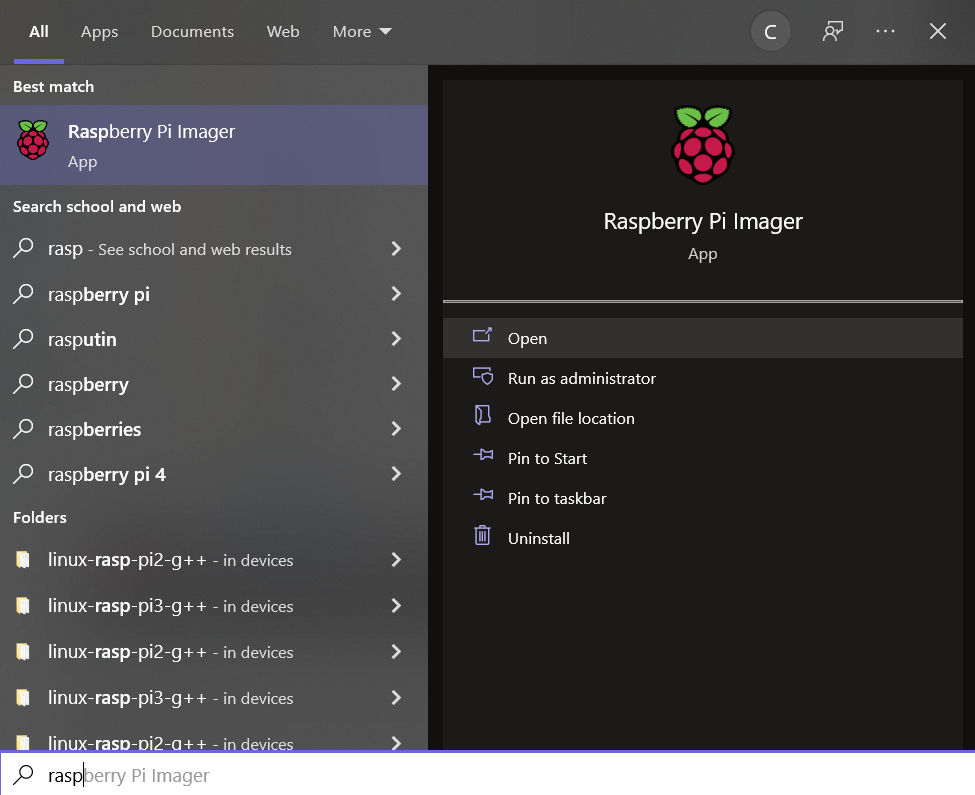
Step 7: Now search for "Raspberry Pi Imager" on your computer. On Windows, it should pop up as shown here. Click Open. If the pop-up window asks if you would like Raspberry Pi Imager to make changes to your device, click Yes.
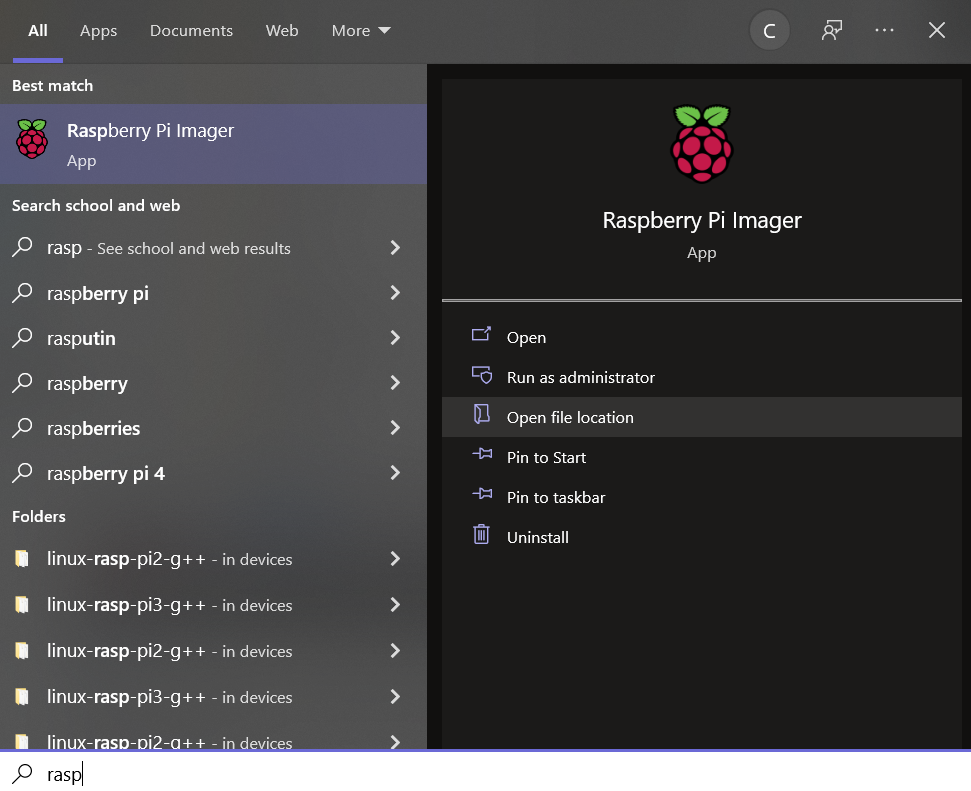
Tip: If you're interested in keeping your file system organized like I am, you can find where the application is stored by clicking Open File Location.
Step 8: Connect your microSD card to your computer using the adapter of your choice.
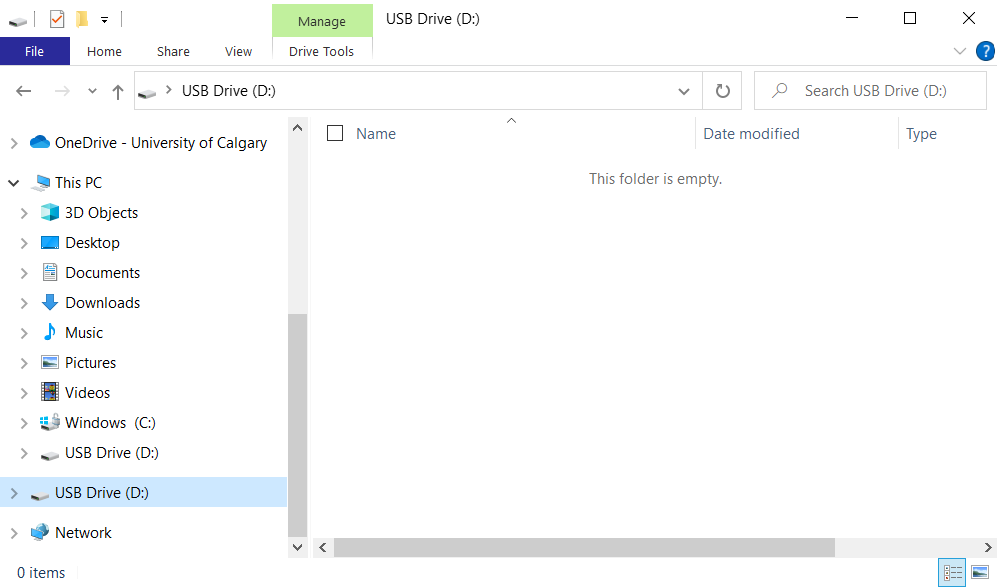
Step 9: Identify the name of the drive (the microSD card) you just connected using your File Explorer or Finder. On my computer, it is the D:/ drive but this may be a different letter for you. The important part is that it is not the drive that all of your computer files are stored on (my C:/ drive).
Step 10: In Raspberry Pi Imager, we now need to select the Operating System we want and where we want to store it.
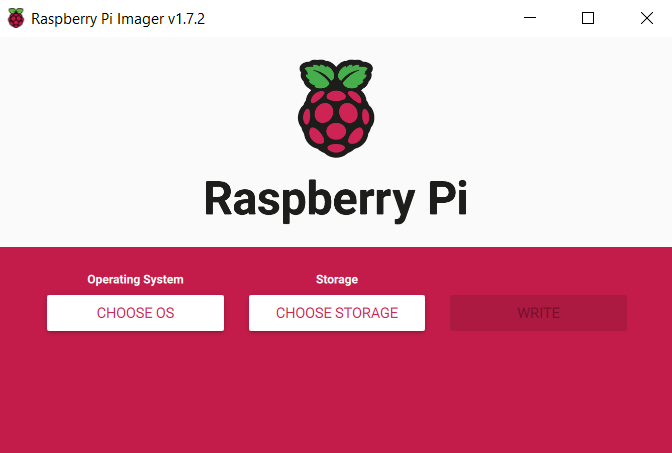
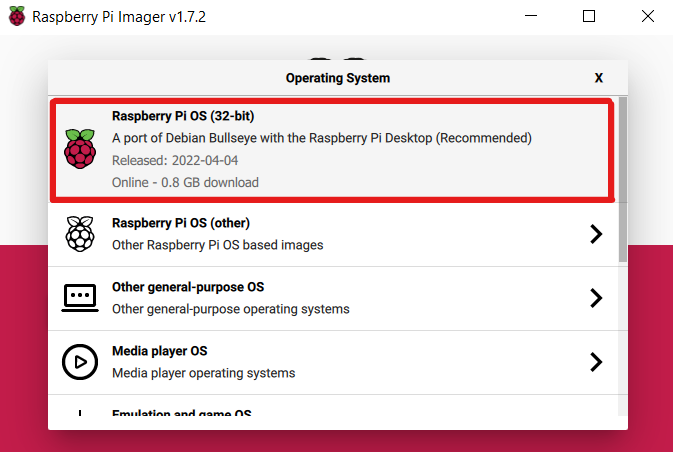
For the Operating System choose the Raspberry Pi OS (32-bit) option.
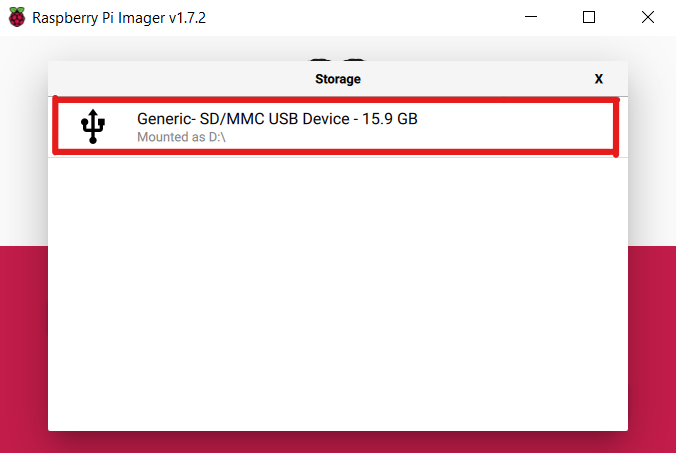
For the Storage choose the drive you just inserted (for me, the D:/ drive).
WARNING:DO NOT CHOOSE A DRIVE YOU ARE NOT 100% CERTAIN ABOUT.
This will overwrite the drive, which is IRREVERSIBLE. If you are unsure about which Storage option to choose, ask a friend, professor or TA for help.
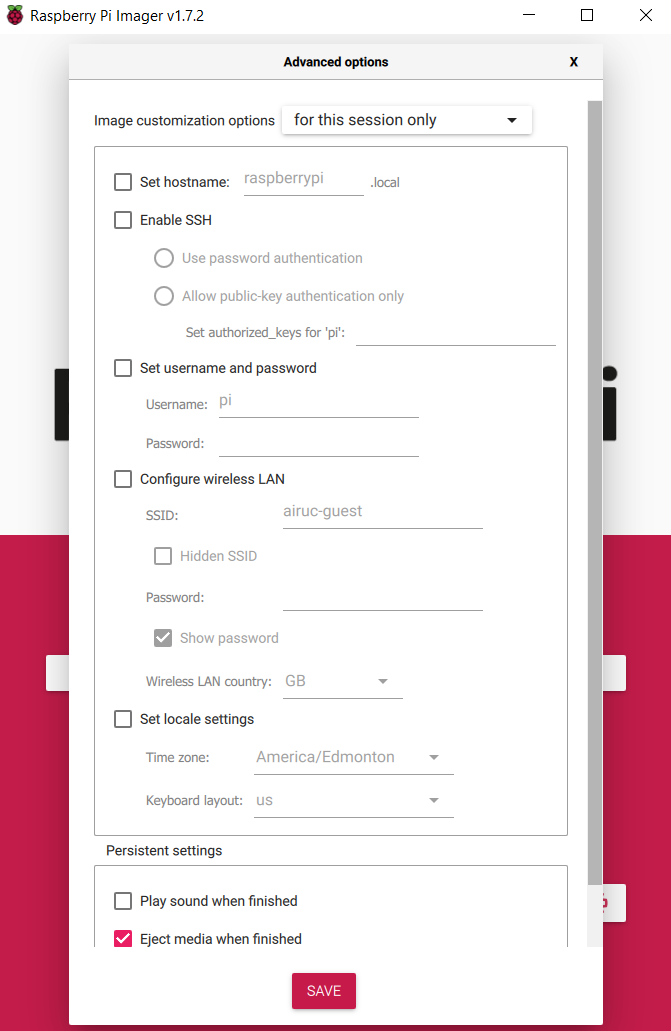
A Note About Advanced Settings: These settings are found under the gear wheel button. I chose to keep all buttons checked off except for the two at the bottom - Eject media when finished and Enable telemetry (not pictured). These settings can be changed after the OS is "flashed" onto the microSD card.
Step 11: When you are satisfied with your Operating System, Storage and Advanced Settings choices, click Write. Make sure your computer is plugged in to a power source for this since it might take a while. Mine took a little over 30 minutes to write. Note that the adapter and microSD card will automatically be ejected when it is done.
1.4: Powering Up the Raspberry Pi
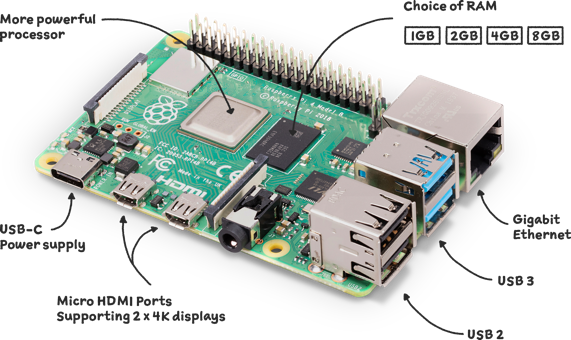
Now we need to connect all the bits and bobs to our Raspberry Pi. The main challenge here is making sure you have the right cable for the job. Here are the ports we can use, courtesy of the official Raspberry Pi website:
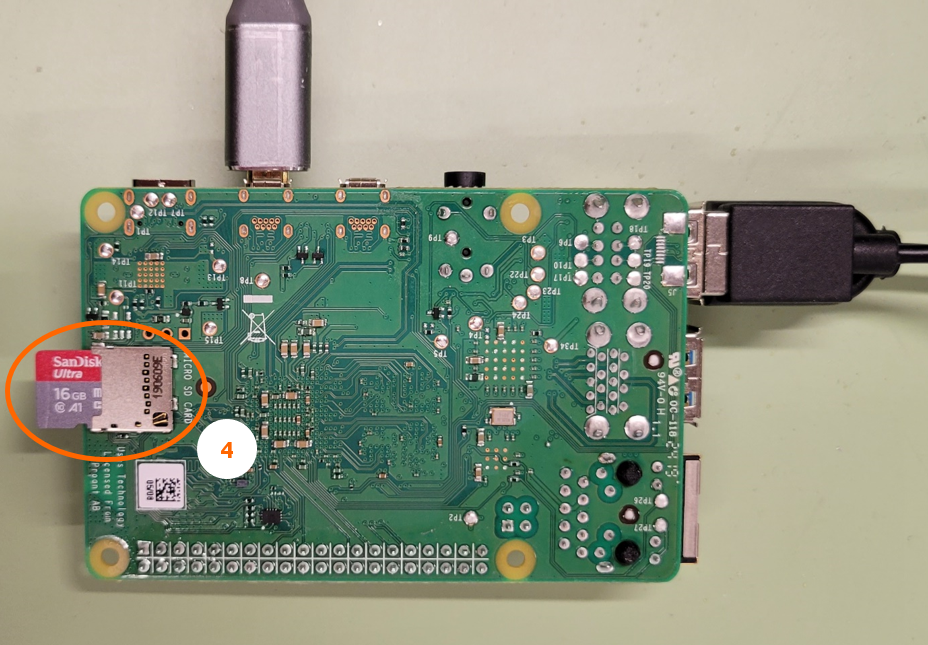
Here's my setup:
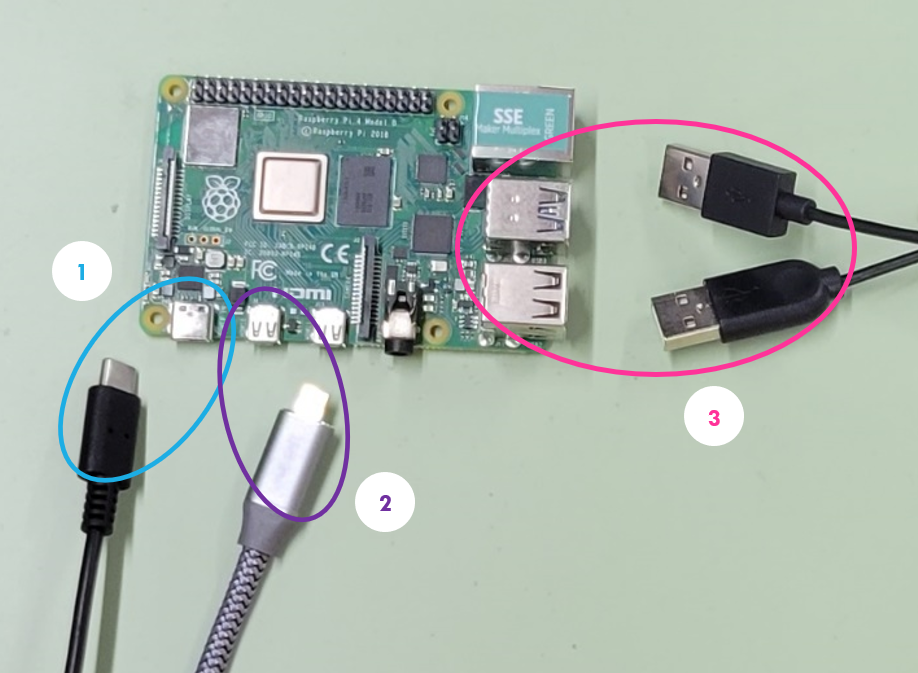
- USB-C Power Cable
- Monitor Connected via Micro HDMI Cable
- Keyboard and Mouse connected via USB cable in the USB 2 ports
- Micro SD Card (inserted into the slot on the underside of the Raspberry Pi)
Using a USB-C power cable with an on/off switch makes it much easier to turn your Raspberry Pi on or off. Without a switch, you will be constantly unplugging and plugging the USB-C back in, since they do not have a built-in power button.
1.5:Navigating the Startup Menu
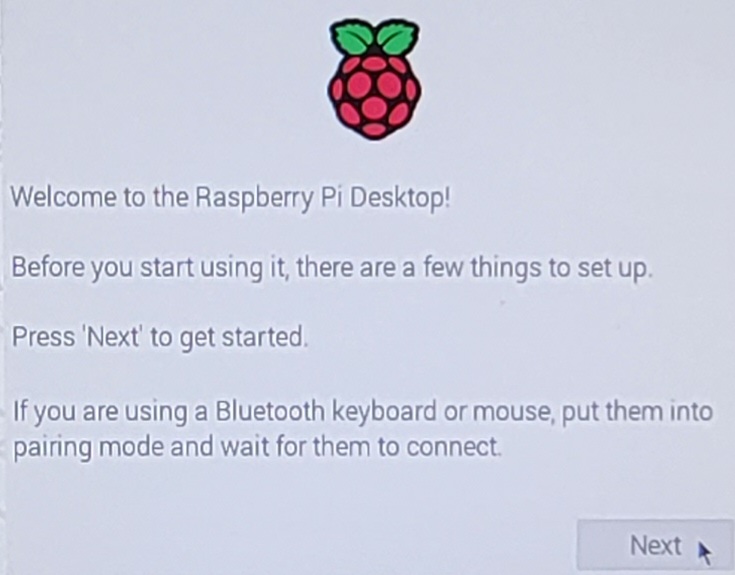
When you plug the power into your Raspberry Pi, it automatically turns on. There is no built-in power button on your Raspberry Pi, so it will turn on if power is supplied to it. If your microSD card has been inserted into the Raspberry Pi, a Startup Menu will appear as shown below.
Click Next to begin the setup process.
Set your language, time zone and keyboard. If you are doing this from Calgary, AB and you need an English keyboard, select the options shown here.
Click Next to move on.

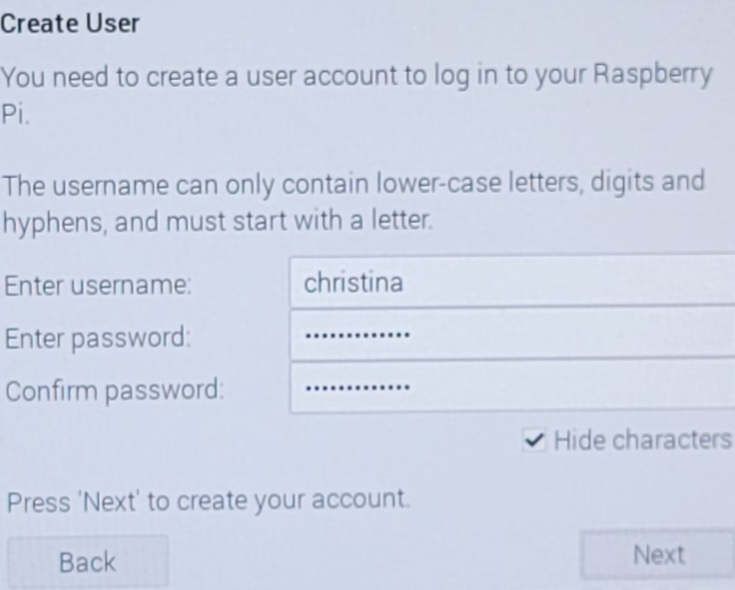
Choose a username and password. This will be your user account on the Raspberry Pi.
Make sure you write the username and password down, since you will need them later.
Click Next to create your account.
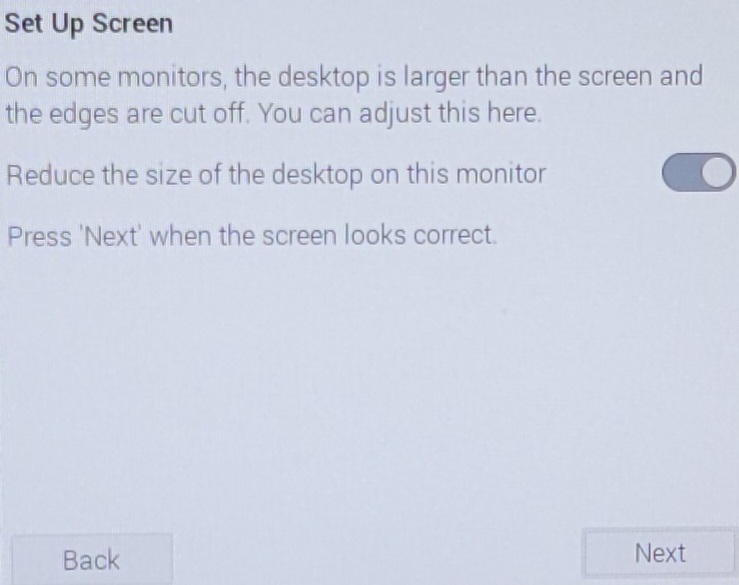
If there is no black border between the Raspberry Pi desktop and your monitor, it is possible that the monitor is slightly cutting off the display.
In this case, click the button shown in the image to reduce the desktop size.
It may take several seconds for this to take effect. You may also need to continue through the setup pages before the changes take effect.
Click Next to continue. If you change your mind, you can click Back to return to this page.
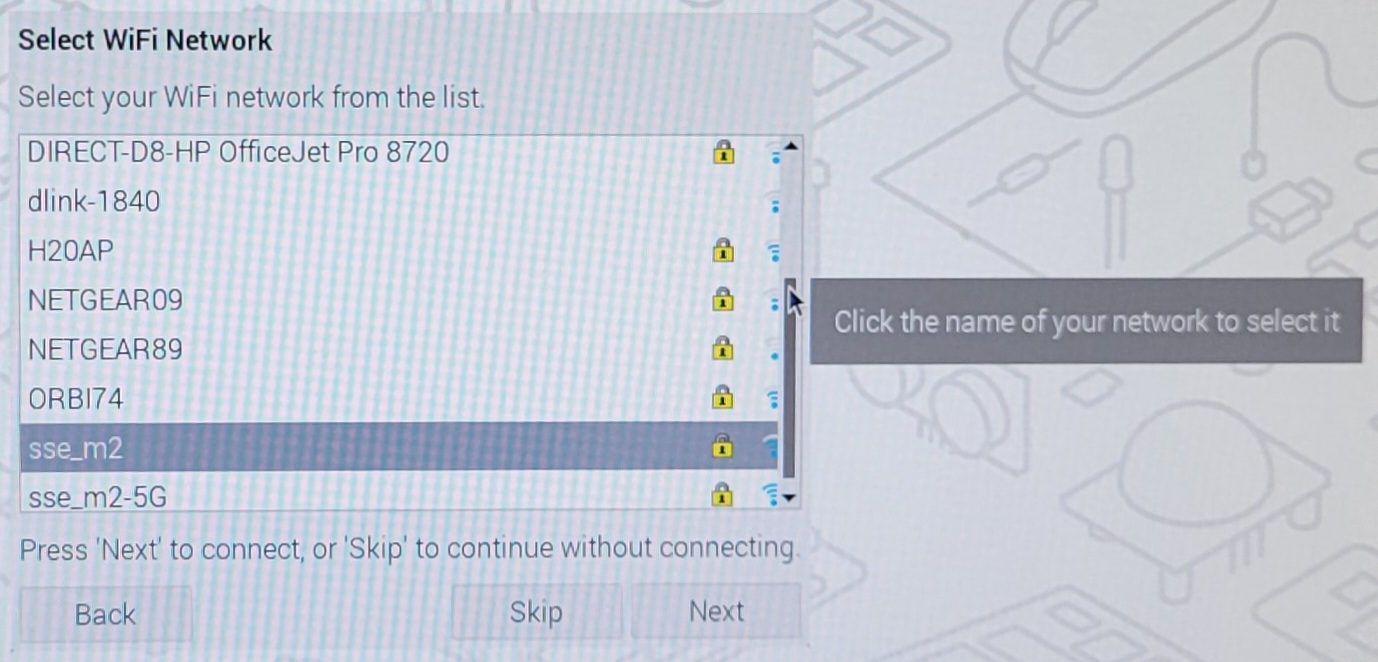
Select the WiFi network you want to connect to and click Next to connect and input the WiFi password.
Or, click Skip to continue without connecting to WiFi.
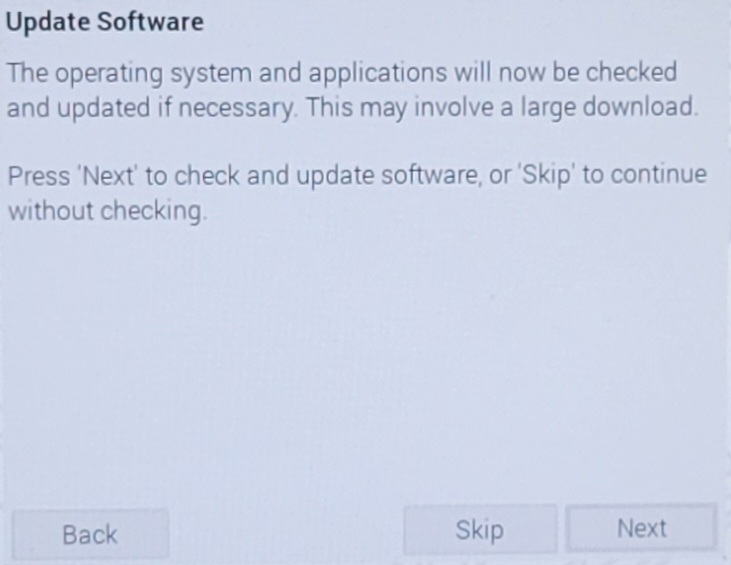
Click Next to check and update the software.
This may take a while. My updates took a little longer than ten minutes.
Click Restart to make the new settings take effect.
If the Raspberry Pi does not appear to be turning back on, try unplugging the power, waiting a couple seconds, and plugging it back in.
If that doesn’t work, try doing the same thing with both the power and the Micro HDMI cables.
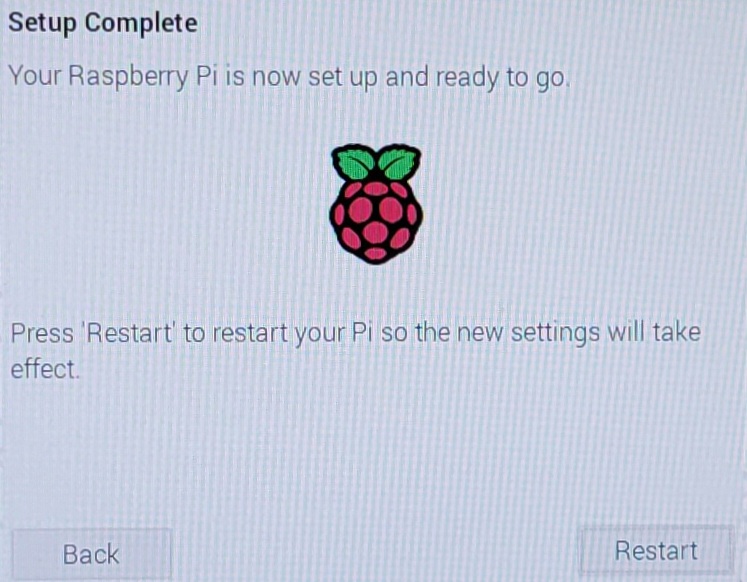
Congratulations! You have successfully set up your Raspberry Pi 4.

1.6:Connecting via SSH
There are a few main ways to access your Raspberry Pi. We just completed the first method – plugging in a monitor, mouse and keyboard to use the Raspberry Pi like a home computer. Another popular way to use your Raspberry Pi is through a Secure Shell (SSH) connection. Here’s what you need to know about SSH:
- It allows you to run the terminal (command line interface) on your Raspberry Pi from the terminal on your own computer
- You can also share files between the Raspberry Pi and your own computer
- Both the Raspberry Pi and your own computer must be connected to the same network
- You need to know the IP address of the Raspberry Pi on that network
- You need to know the username and password from your Raspberry Pi user account we created in section 1.5
- You won’t need to plug all of the cables and gadgets into your Raspberry Pi, only the power cable
SSH can be very useful if you want your Raspberry Pi to control something remotely, like a sensor or robot. It removes the desktop we saw in 1.5, so there is no need for a screen or a Graphical User Interface (GUI).
The content in Section 1.6 is based on the article SSH:Remote control your Raspberry Pi by Russell Barnes in The MagPi Magazine (https://magpi.raspberrypi.com/articles/ssh-remote-control-raspberry-pi).
Let’s set up our SSH connection! With the setup from section 1.5, follow these steps:
Step 1: Get the IP address of your Raspberry Pi on that network
- Make sure your Raspberry Pi is on the same network (WiFi or Wired LAN) as your computer. To check this, go to the top right corner of the desktop and click the WiFi button.
- Open a Terminal. You can do this by clicking the terminal button in the top left corner of the desktop or by pressing Ctrl + Alt + T on the Raspberry Pi’s keyboard.
- In the terminal, there are two ways to find the IP address:
- (Easiest Method) Type hostname -I and hit Enter to get the IP address on that network. Shown below, the IP address is 192.168.1.138. This will be a different address on each network.
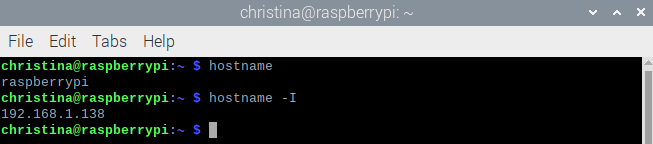
OR
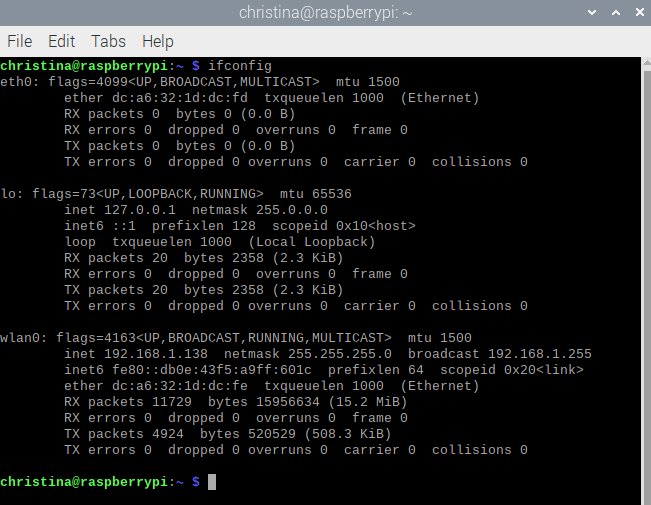
- Type ifconfig and hit Enter. The number underneath “wlan0” and beside “inet” is the Raspberry Pi’s IP address on that particular network. Shown below, we get the same the IP address (192.168.1.138).
If you are frequently using the Raspberry Pi under the same network (for example, at your house), write down this IP address since you will be using it often.
Step 2:Enable SSH on the Raspberry Pi
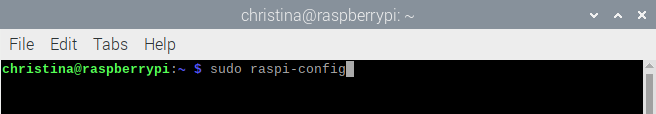
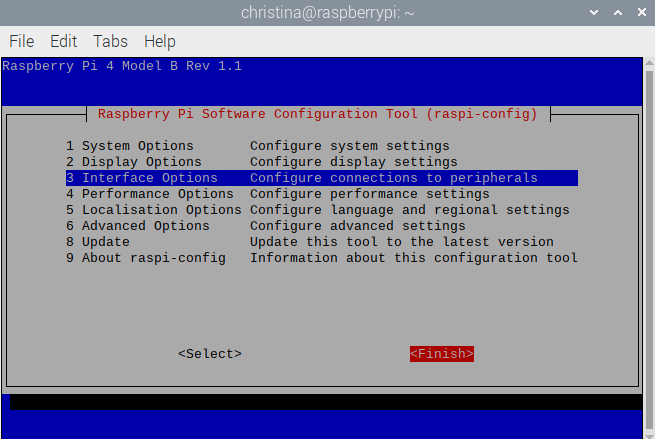
- In the terminal, type sudo raspi-config and hit Enter. This will take you to the Configuration Tool.
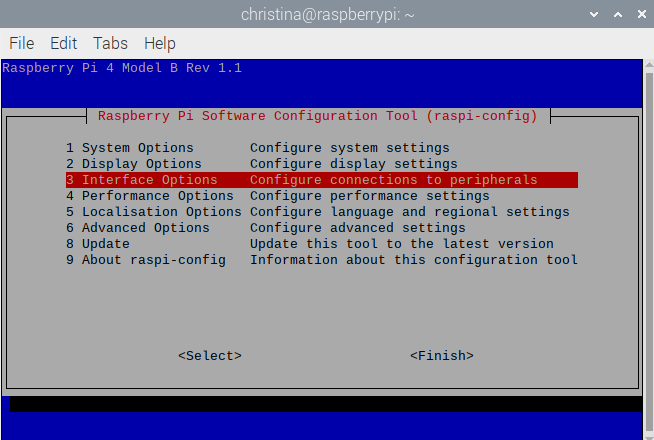
- On the Configuration Tool, use the up and down arrows to select Interface Options. Press Enter.
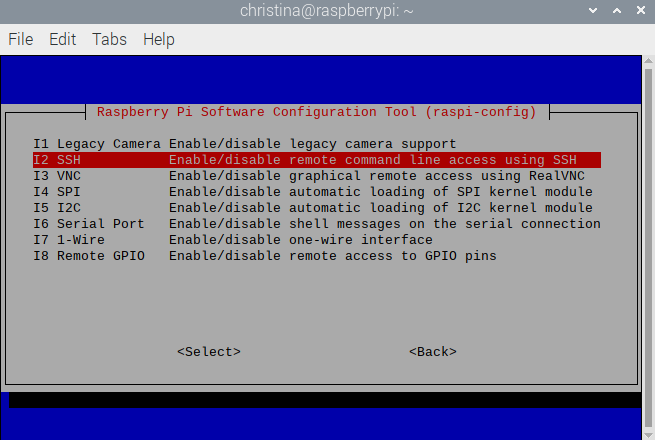
- Use the up and down arrows to select SSH. Press Enter.
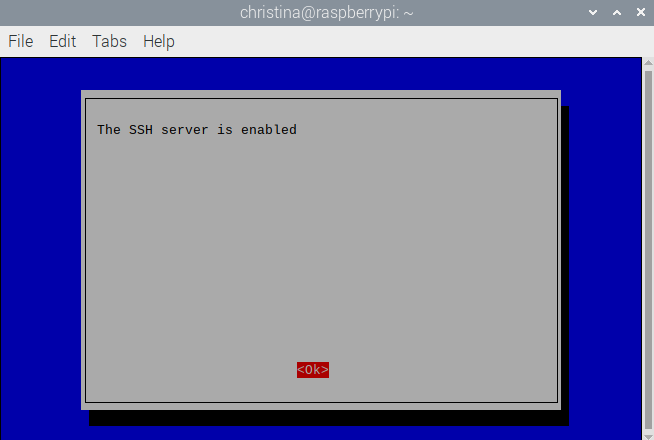
- Select Yes and hit Enter to enable SSH on the Raspberry Pi.
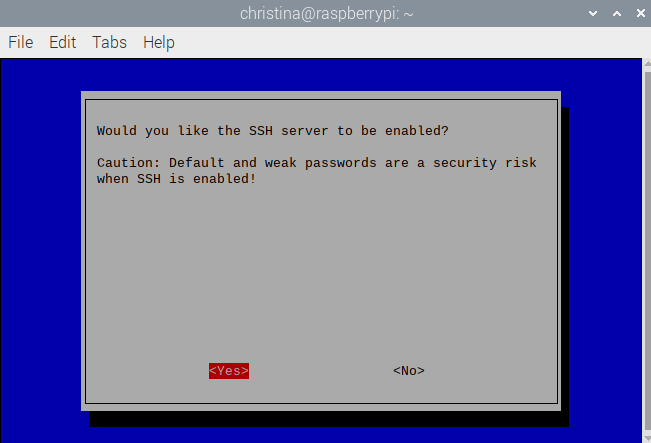
- Press Enter.
- On the Configuration Tool, use the Tab key to access the "Select" and "Finish" buttons at the bottom. Use the left and right arrow keys to select Finish and hit Enter.
Step 3: Activate SSH Client (Windows)
- This step is not needed for Linux or macOS.
- In Windows 10, you can use SSH without having to download anything, but you need to activate it first.
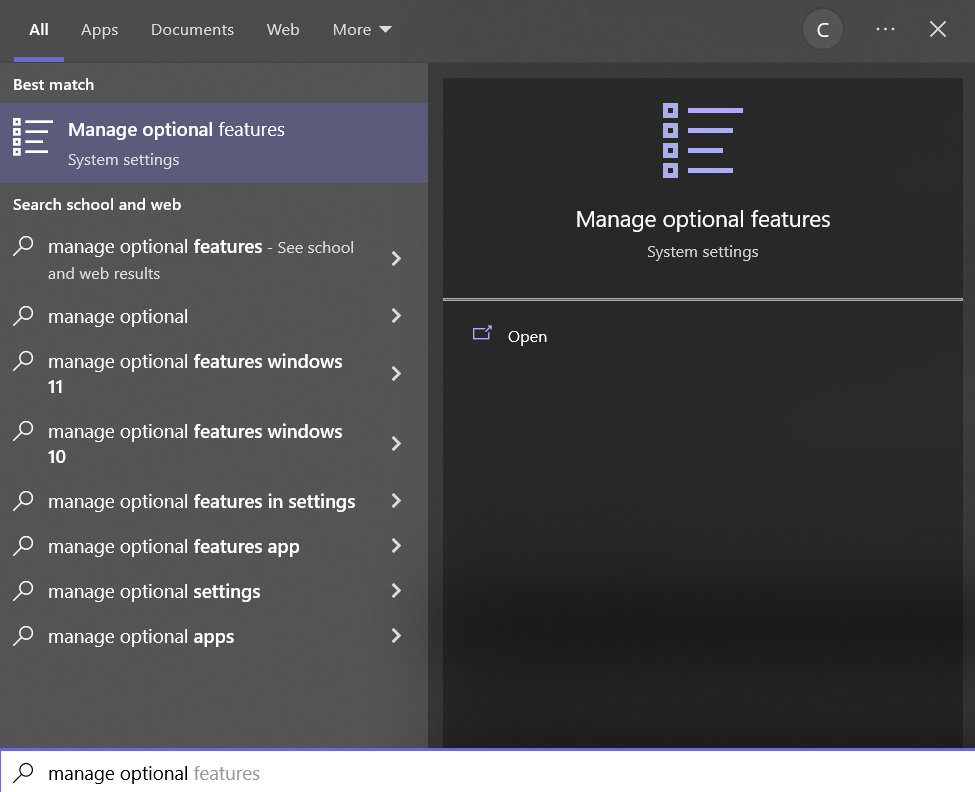
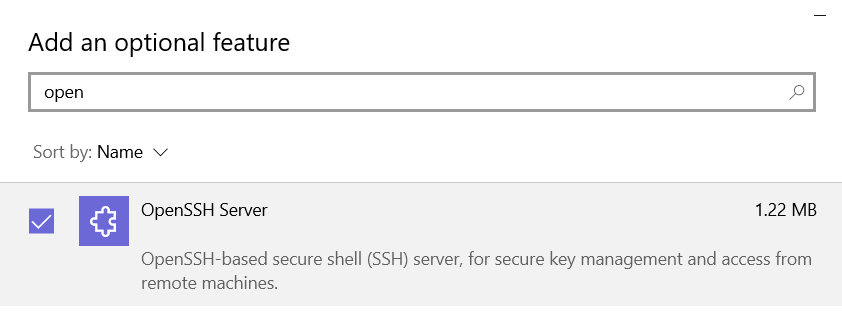
- On your computer, search for and Open “Manage Optional Features”.
- Click Add a feature.
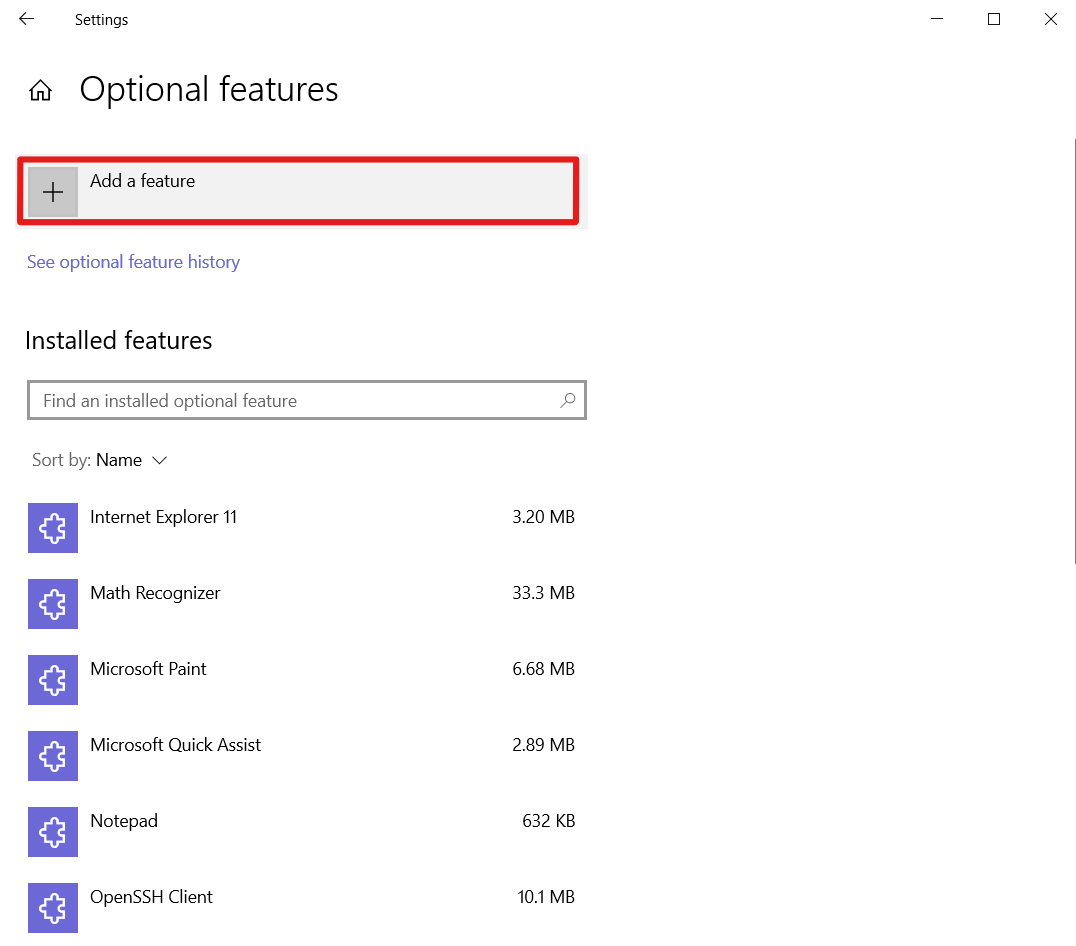
- Search for OpenSSH Server (may also be called OpenSSH Client). Install it.
Step 4: Access Raspberry Pi via SSH Client
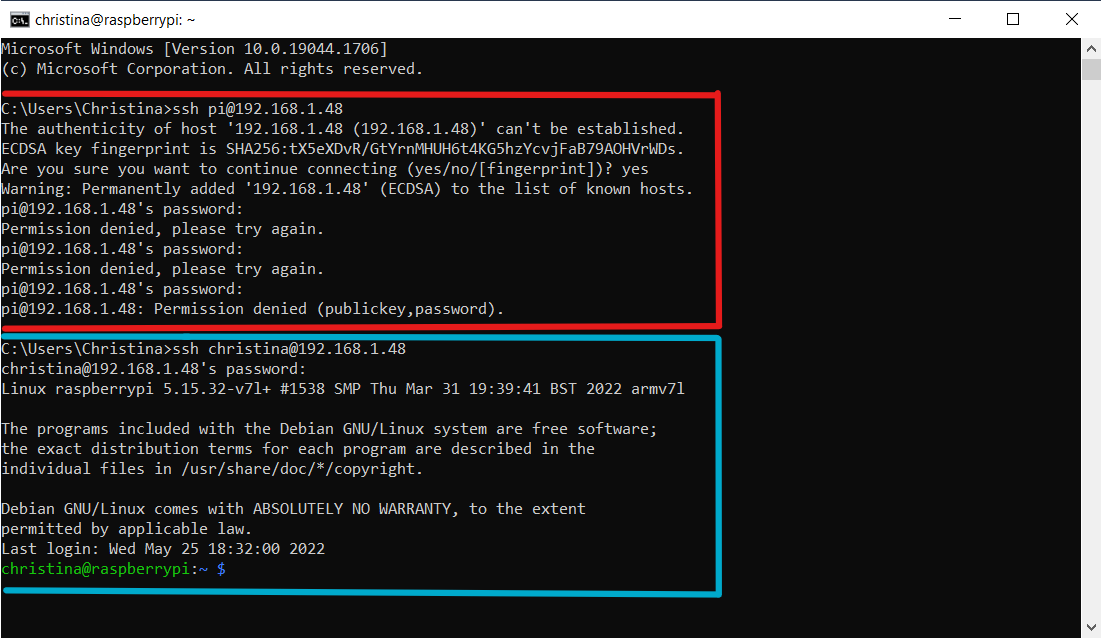
Open a Terminal/Command Prompt on your computer and type in ssh [username]@[IP] and press Enter. For example, since my username is “christina” and the Raspberry Pi IP address in the Makerspace is 192.168.1.48, I type in ssh christina@192.168.1.48.
If this is your first time using SSH, it may say that the authenticity cannot be established and it will ask, “Are you sure you want to continue connecting?” Type yes and hit Enter.
You will then need to enter your password for the Raspberry Pi that we wrote down in Section 1.5.
Note that the password will not appear on the screen as you are typing it.
Step 5: Exiting SSH
If you want to end the SSH connection, type exit into the terminal and hit Enter.
The Raspberry Pi terminal uses Linux commands. An easy guide to Linux commands can be found on the SSE Tech Support website under M2Z > Learning Resources > Programming Skills and Tools > Linux Terminal (https://schulich.libguides.com/c.php?g=721481).> Troubleshooting and Problem Solving:
While trying to connect via SSH, I had the following problems:
- My laptop was connected to a different network than the Raspberry Pi, so the SSH connection was refused
- I entered the wrong username into the terminal (shown in red), so it didn’t recognize the password I had written down
Once I solved these problems, I had success connecting (shown in blue).
If you are having difficulty connecting, look for the problems listed above. You can also double-check that your IP address is correct and that the power to the Raspberry Pi is on. If these do not work, try using PuTTY to connect (see the article link in the green box at the beginning of this Section).
Phase 2: Connecting the Sensors
You will need:
- A computer
- A Raspberry Pi 4 Model B with microSD card and OS already installed (Phase 1)
- A USB-C power cable (with an on/off switch is best)
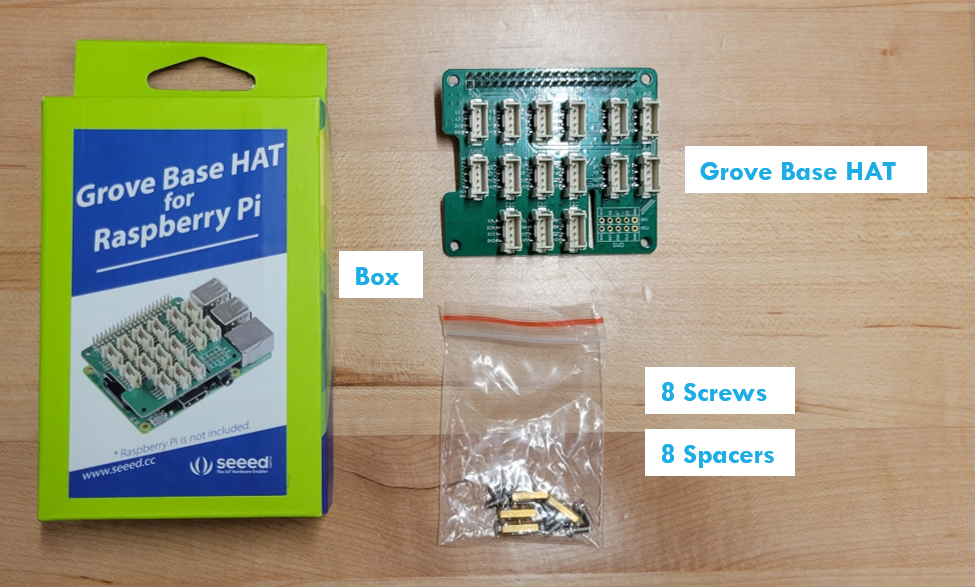
- A Grove Base HAT for Raspberry Pi with included Screws and Spacers (Seeed brand)
- A Grove Temperature & Humidity Sensor with included Ribbon Cable (Seeed brand)
- A DHT11 Temperature & Humidity Sensor
- 3 Female-to-Male electrical wires (should be compatible with a breadboard)
- A Solderless Breadboard
- Small Phillips-Head Screwdriver (size 0)
Estimated Time Required: 3 Hours
2.1: Connecting the Grove Base HAT
The Grove Base HAT for Raspberry Pi should include the Base HAT (a nifty way to connect sensors to your Raspberry Pi), four spacers and eight screws. The unit is called a HAT (Hardware Attached on Top) because it sits on top of the Raspberry Pi!
The content in Section 2.1 is based on the article How to mount a Grove Base Hat for Raspberry Pi by Gerald Venzl (https://geraldonit.com/2020/01/12/how-to-mount-a-grove-base-hat-for-raspberry-pi/).
To connect the Grove Base HAT to the Raspberry Pi, follow these steps:
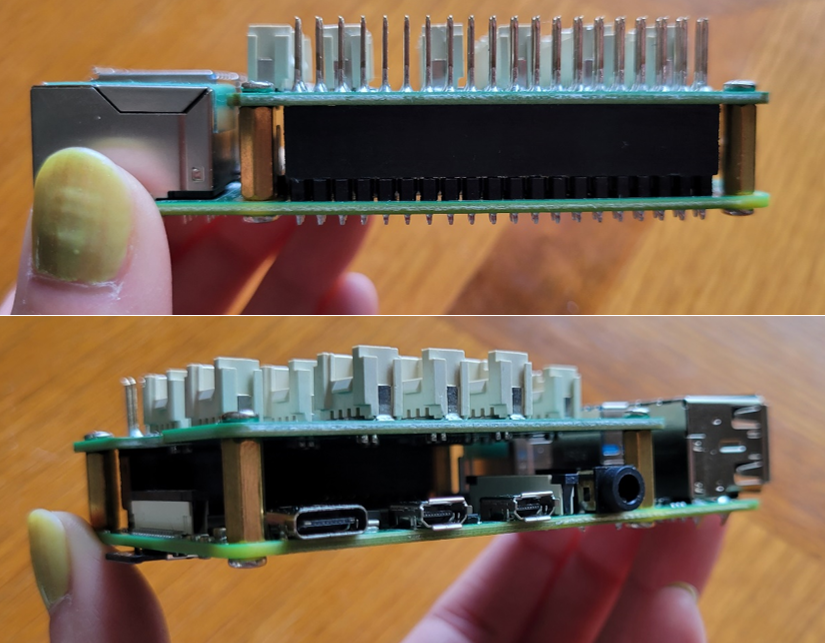
- Using your small Phillips-head screwdriver, attach the spacers to the Grove Base HAT as shown below.
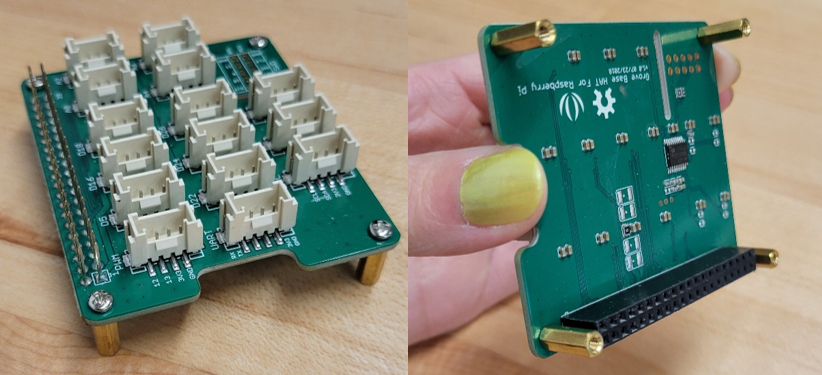
- Carefully press the Grove Base HAT onto the GPIO pins of the Raspberry Pi using the black ports on the underside of the HAT. Be careful not to bend the GPIO pins. Then, use the remaining four screws to attach the HAT to the Raspberry Pi, as shown below.
- Install the Seeed studio provided grove.py software, using one of two methods. Note: Only Method 1 worked for my setup.
Method 1: Git Clone Method, Successful
- Connect to the Raspberry Pi using SSH
- In the Terminal, type git clone https://github.com/Seeed-Studio/grove.py and hit Enter
- Type cd grove.py into the terminal and hit Enter
- Type sudo pip3 install . and wait for it to install (this may take a minute)
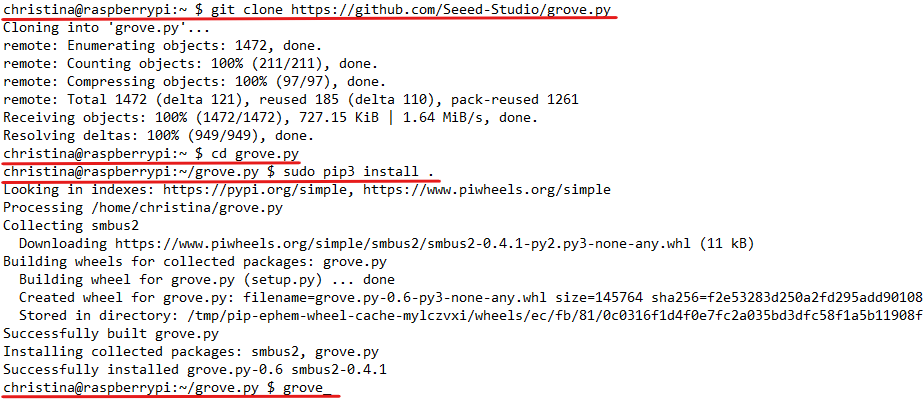
The git clone method can also be found on the Seeed Studio webpage for the Grove Base HAT (https://wiki.seeedstudio.com/Grove_Base_Hat_for_Raspberry_Pi/).
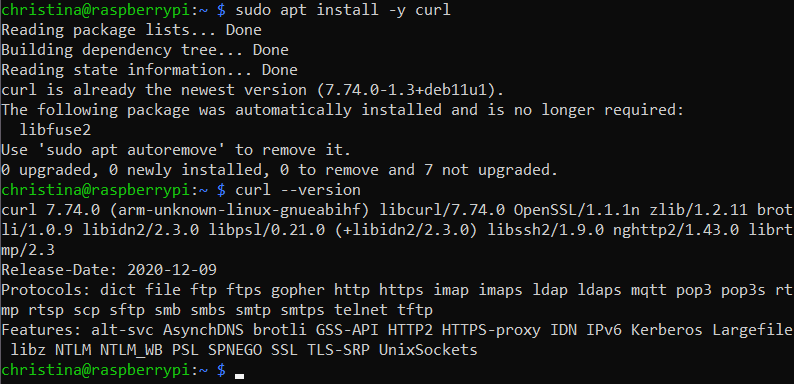
Method 2: Curl Method, Unsuccessful
- Connect to the Raspberry Pi using SSH
- In the Terminal, type sudo apt update and hit Enter (this line was not successful for me)
- Then, type sudo apt install -y curl and hit Enter
- If needed, you can see the version of curl by typing curl --version and hitting Enter
- Then, type curl -sL https://github.com/Seeed-Studio/grove.py/raw/master/install.sh | sudo bash -s –
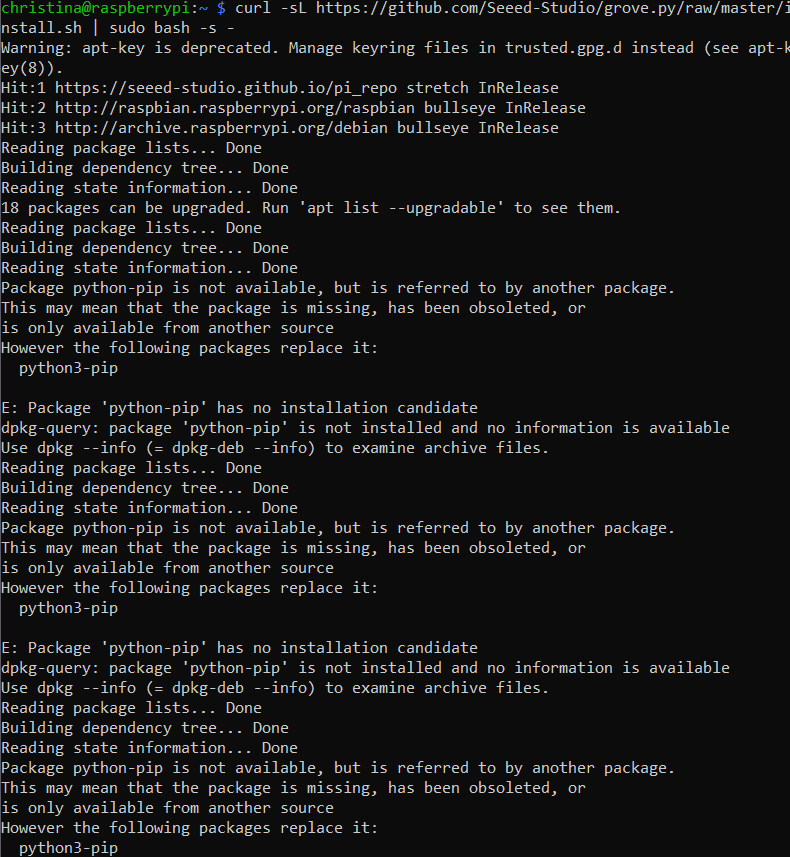
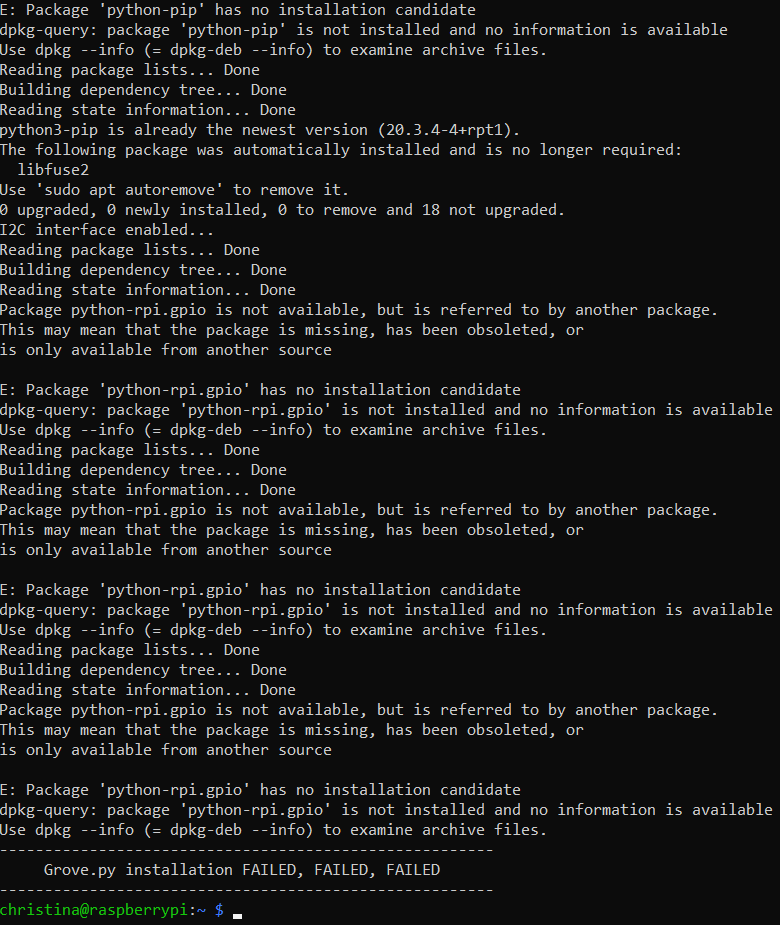
- After grove.py is installed, you can type
grove_into the Terminal and hit Tab. This allows you to see the various modules you can use with your Internet of Things (IOT) devices.
2.2: Connecting the Grove Temperature and Humidity Sensor
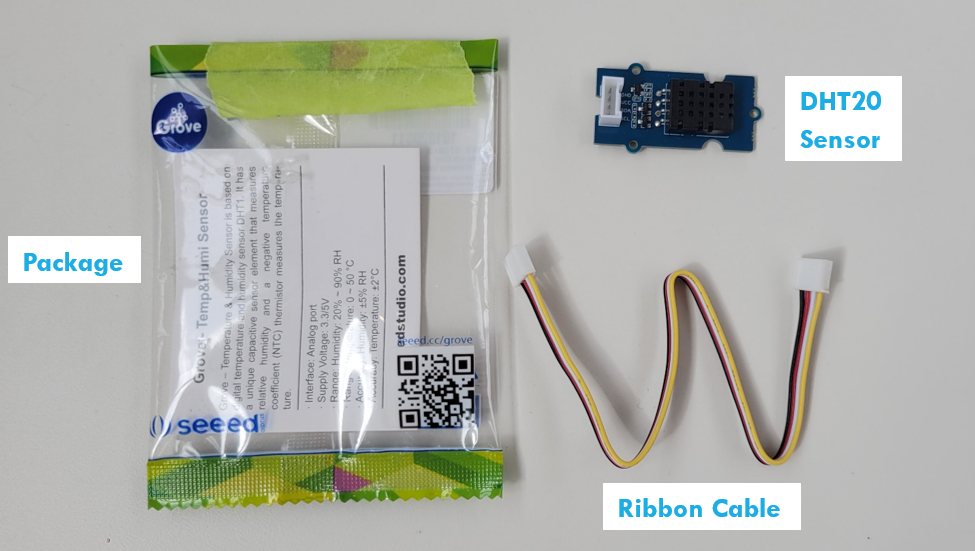
Even though it is not obvious from the packaging, the Grove Temperature and Humidity Sensor Version 2.0 is a DHT20 sensor. You may find this information useful during research. Your package should look something like this:
The content in Section 2.2 is based on the article How to use a Grove Temperature and Humidity Sensor Pro with a Raspberry Pi by Gerald Venzl (https://geraldonit.com/2020/01/19/how-to-use-a-grove-temperature-and-humidity-sensor-pro-with-a-raspberry-pi/).> Using Secure Copy (SCP):
In this section, we need to transfer files from our personal computer to the Raspberry Pi. We can do this using Secure Copy (SCP).
Since we already enabled SSH, SCP is also enabled.
Here’s what to do:
1. Make sure your personal computer is on the same network as the Raspberry Pi, just like you would do for an SSH connection.
2. In the Command Prompt on your computer, navigate to the folder that contains the file you want to transfer. On Windows, you can do this using the cd and dir commands.
3. From that location, type into the terminal: scp filename.txt username@[IP]:folder/
4. You will then need to input the password of your Raspberry Pi.
For example, if we needed to save a file called test_code.py to the “Code” folder on the Raspberry Pi at the IP address 192.168.1.138, the line would look like this:
scp test_code.py christina@192.168.1.138:Code/
Note that the folder you specify is the location you want to save the file to on the Raspberry Pi. The folder is the file path relative to the “Home” folder on the Raspberry Pi.> You can learn more about Secure Copying with the Raspberry Pi here (https://howchoo.com/pi/how-to-transfer-files-to-the-raspberry-pi).
To connect the Raspberry Pi to the Grove Temperature and Humidity Sensor, we need to do the following:
Step 1: Install needed packages
- Connect to the Raspberry Pi via SSH
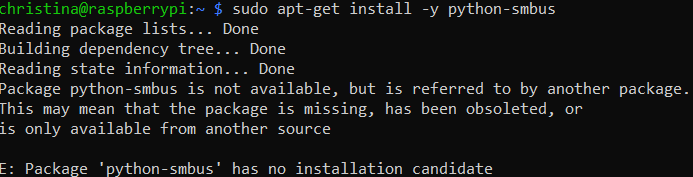
- Install the seeed-python-dht package: Type pip3 install seeed-python-dht into the Raspberry Pi terminal and hit Enter
- Install the python-smbus package: Type sudo apt-get install -y python smbus into the Raspberry Pi terminal and hit Enter. Note: This may not work as the package has become obsolete
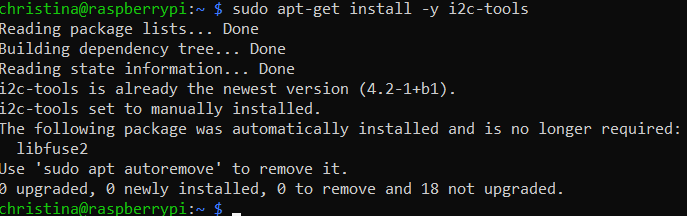
- Install the i2c-tools package: Type sudo apt-get install -y i2c-tools into the Raspberry Pi terminal and hit Enter
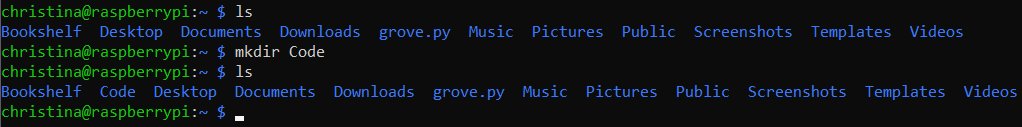
Step 2: Make a folder to put our test code into called “Code”
- If you type ls into the terminal, it lists all of the files and folders under the “Home” directory
- Type mkdir Code in the terminal to create a folder called “Code” under the “Home” directory
- We can confirm that the folder was created using ls again
Step 3: Put some test code onto the Raspberry Pi
- On your personal computer, create a Python script that will be used to test if the sensor is properly connected. I called mine “i2c_grove_test.py” and I used the code here, from user ultracold on the Raspberry Pi Stack Exchange: https://raspberrypi.stackexchange.com/questions/133457/how-can-rpi4b-use-python-to-talk-to-the-i2c-dht20-sht20-temperature-and-humidi
- In the Raspberry Pi Terminal, type exit and hit Enter to end the SSH connection
- Using Secure Copy (SCP), copy this new file into the “Code” file of the Raspberry Pi. Do this by navigating to the directory containing “i2c_grove_test.py” in your command prompt, and then typing the line:
scp i2c_grove_test.py username@[IP]:Code/
For example, mine was:
scp i2c_grove_test.py christina@192.168.1.138:Code/
Step 4: Plug the sensor in
- If you are still connected to the Raspberry Pi via SSH, type exit to end the connection
- Power off the Raspberry Pi. Since we will be plugging things into it, it’s a good idea to unplug the power cable as well
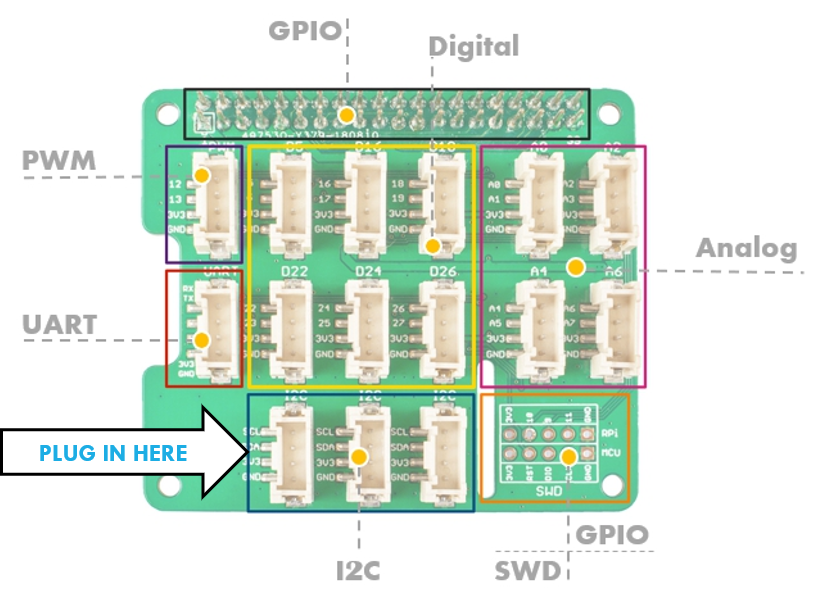
- Using the ribbon cable that comes with the Grove Temperature and Humidity Sensor, plug the sensor into the first I2C port of the Grove Base HAT (labelled on the official pinout below)
Step 5: Power on the Raspberry Pi and reconnect via SSH
Step 6: Enable the use of the I2C ports
- In the Raspberry Pi terminal, type sudo raspi-config and hit Enter
- Like you did in Section 1.6, choose Interface Options and hit Enter
- Now, instead of choosing SSH we will now choose I2C (option I5 below). Navigate through the menus and enable the I2C ports
Step 7: Find the I2C address
Now comes an interesting part. We need to know the I2C address of our sensor so our code can talk to it. But how do we do this? We use the line i2cdetect -y 1 in our Raspberry Pi terminal. With the sensor attached, your output should look something like this:
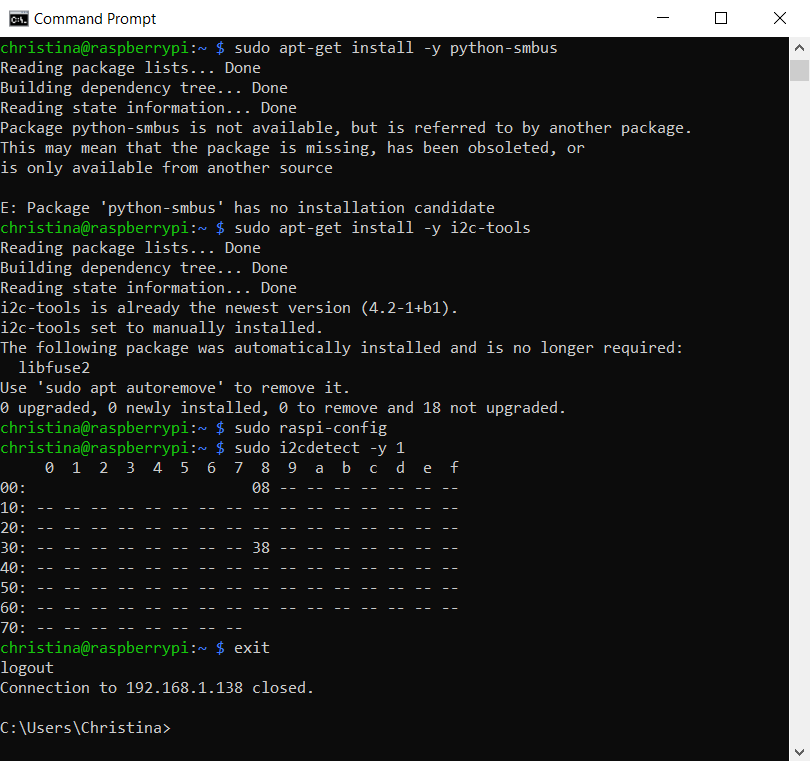
Note that there are two numbers that show up: 08 and 38. This means that the Raspberry Pi recognizes two sensors, one with the address 0x08 and the other with the address 0x38.
The “0x” part that we add on to the number just means the address is a hexadecimal code.
You may be wondering how we can tell which number is the address of our sensor. Simple!
- Exit the SSH connection and power off and unplug your Raspberry Pi
- When the power cable is unplugged, unplug the Grove sensor
- Plug the power cable back in and power on the Raspberry Pi
- Run the I2C detection code again
You should get something like this:
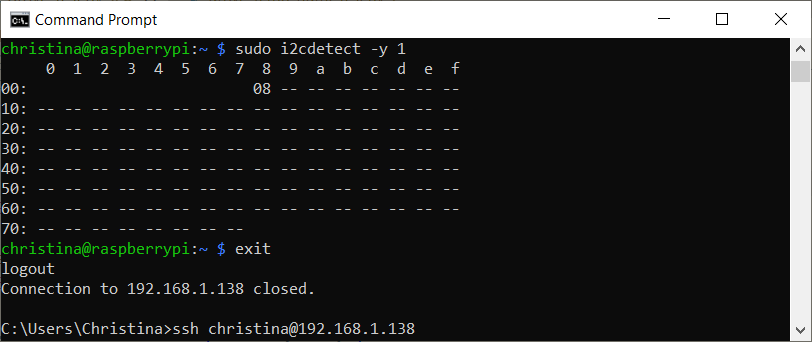
Notice how we don’t get the 0x38 address when the sensor isn’t plugged in? This means that 0x38 is the I2C address of the sensor when plugged in to the first I2C port.
A Few Notes About I2C Addresses:
- There is no guarantee that the sensor will have the same I2C address if you plug it into one of the other I2C ports. Make sure you use the same port every time or check the I2C address again.
- Don’t worry if you don’t get the same numbers as I did above. The important part is finding the address for your sensor.
- The purpose of the 0x08 I2C address is somewhat unclear. It may be a master or default I2C address. Either way, you may see it used in code to test if the I2C connection is set up properly. This is shown in the i2c_grove_test.py code below (lines 12-14), where “Initialization Error” is printed if there is no 0x08 present:
# User ultracold

import time
import smbus

address = 0x38 #Put your device's address here

i2cbus = smbus.SMBus(1)
time.sleep(0.5)

data = i2cbus.read_i2c_block_data(address,0x71,1)
if (data[0] | 0x08) == 0:
  print('Initialization error')

i2cbus.write_i2c_block_data(address,0xac,[0x33,0x00])
time.sleep(0.1)

data = i2cbus.read_i2c_block_data(address,0x71,7)

Traw = ((data[3] & 0xf) << 16) + (data[4] << 8) + data[5]
temperature = 200*float(Traw)/2**20 - 50

Hraw = ((data[3] & 0xf0) >> 4) + (data[1] << 12) + (data[2] << 4)
humidity = 100*float(Hraw)/2**20

print(temperature)
print(humidity)
Step 8: Modify your test code if necessary:
- In the i2c_grove_test.py code above, you need to make sure that the default address (0x08) and sensor address (0x38) are included in the code. If you have different addresses in your setup, use those.
You may also want to change the print statements. Right now, it will only print the temperature and humidity values but it is not obvious to a user which number is which. I recommend changing them to something like:
print(“Temperature: ”, temperature)print(“Humidity: ”, humidity)On the Raspberry Pi terminal, you can use the command nano to access and modify files using the GNU Nano text editor.
- Navigate to the location of the test file by using cd (change directory) to get to the “Code” folder. The line should be cd Code. Then, hit Enter.
- Next, type nano i2c_grove_test.py and hit Enter. This will allow you to edit the file and move around the lines of code using arrow keys.
- There are commands at the bottom of the screen that tell you what to do (shown below). Note that “^X” means Ctrl + X. The file will ask you if you want to overwrite (save your changes) before editing. Select Yes.

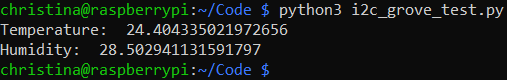
Step 9: Finally, run the test code!
- In the Raspberry Pi terminal, navigate to the “Code” folder that contains the i2c_grove_test.py file (same command as before, use cd Code).
- Then, type python3 i2c_grove_test.py and hit Enter. This will run the file, which will look something like this:
Troubleshooting:
- If the Python script will not run, check for errors in your code. If this does not solve the problem, it may help to make the first line of the code #!/usr/bin/python3 since this tells the system to use Python3 as the interpreter directly.
- If the temperature and humidity values are all zeros, this is a sign that the code is not actually talking to the sensor. Check that you have the right I2C addresses and, if necessary, unplug the power and unplug/plug in the sensor to the Grove Base HAT again.
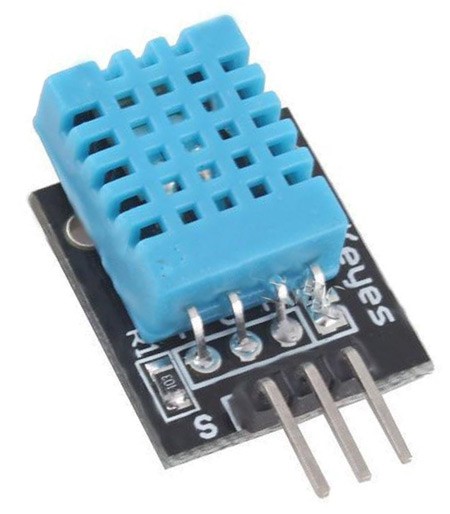
2.3: Connecting the ASAIR DHT11 Sensor
Now that we have successfully connected one temperature and humidity sensor to the Raspberry Pi, we will connect a sensor of a different type that does the same thing. This will be the ASAIR DHT11 sensor, which also collects temperature and humidity data from the environment.
Here’s the key difference: We don’t have a ribbon cable and a port like last time. This sensor needs to be manually connected to the Raspberry Pi’s General-Purpose Input/Output (GPIO) pins using wires and possibly a breadboard.
Your DHT11 should look like the one below. When researching these sensors, pay close attention to the information below:
Be Aware!
While all of these sensors look pretty much the same, researching the wrong sensor will set you back. Here are some things to look for:
- Number of Pins – Does it have three pins coming out of the bottom or four?
- Brand – Is there a brand name visible anywhere on the sensor?
- The Letter S – If there is an “S” on one side of the sensor, it means the pin closest to it is the signal pin. This will be useful when researching pinouts.
- Small LED – Some sensors come with a small LED on the left side that lights up if you have wired it to power correctly. The sensor shown here does not have an LED. The small component above the “S” is a resistor, so don’t expect it to light up!> The content in Section 2.3 is based on the Seeed Studio grove.py documentation:https://github.com/Seeed-Studio/grove.py/blob/master/doc/README.md
Step 1: Find the correct pinout for your DHT11 Sensor:
- A pinout is a diagram that tells you what each pin does on an electrical device.
- Pay close attention to the bullet points in the blue box above; we already know that our sensor has the signal pin on the left.
- Three pins to look for:
- Common Collector Voltage (VCC): The power supply pin, or positive (+) pin. You can use anywhere from 3.3V to 5V with the DHT11.
- Sensor, Signal or Data: The pin that sends the data to the Raspberry Pi. If an “S” is present on the DHT11, it is the pin closest to the “S”.
- Ground (GND): The ground pin, or negative (-) pin. Typically connected using a black-coloured wire.
- Here’s a good pinout to use:

DHT11 pinout reference:https://components101.com/sensors/dht11-temperature-sensor
Step 2: Find the correct pinout for the Raspberry Pi 4 Model B GPIO pins:
- We will need to connect the DHT11 to the GPIO pins of the Raspberry Pi
- We put the Grove Base HAT on top of the Raspberry Pi’s GPIO pins, so now we need to use the Grove Base HAT’s GPIO pins
- The Grove Base HAT has the same pinout as the Raspberry Pi beneath it
- Important Note: Each GPIO pin has both a pin number and a name. Test codes use the name.
- Here’s a good pinout to use:
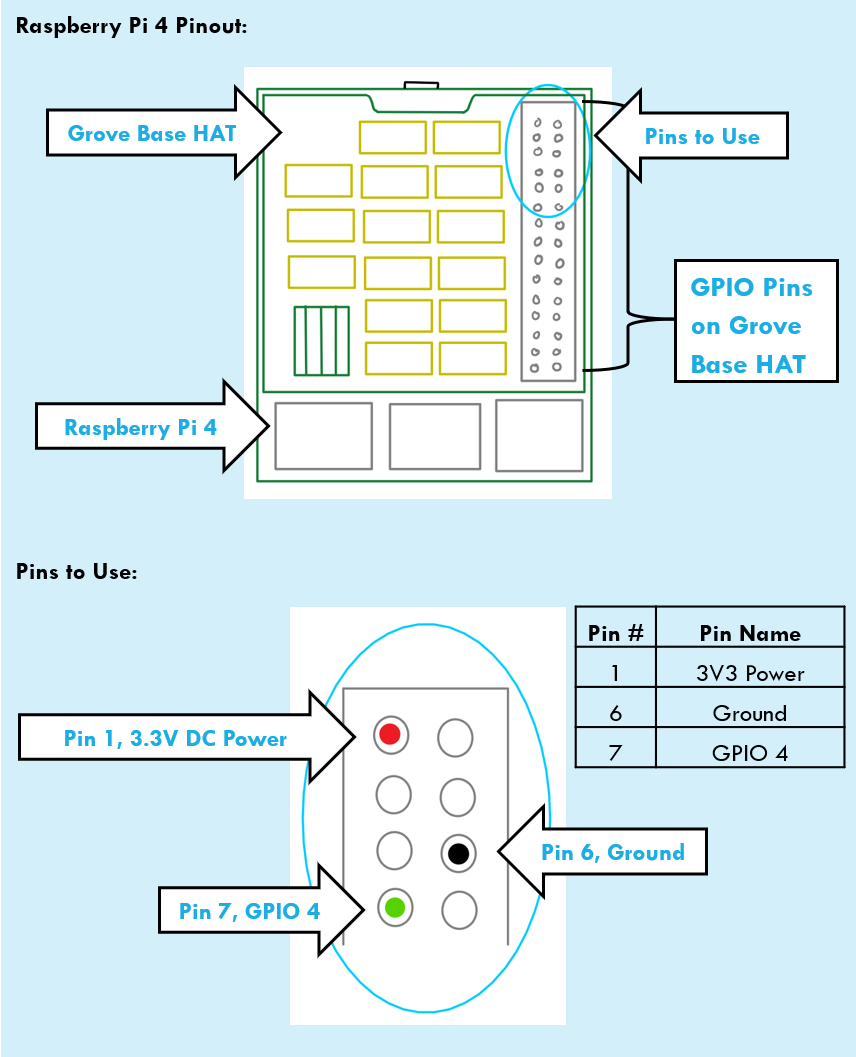
Raspberry Pi 4 GPIO pinout reference:https://linuxhint.com/gpio-pinout-raspberry-pi/
Step 3: Wire the sensor to the Raspberry Pi’s GPIO Pins. Use one of two methods, depending on the wires you have available:
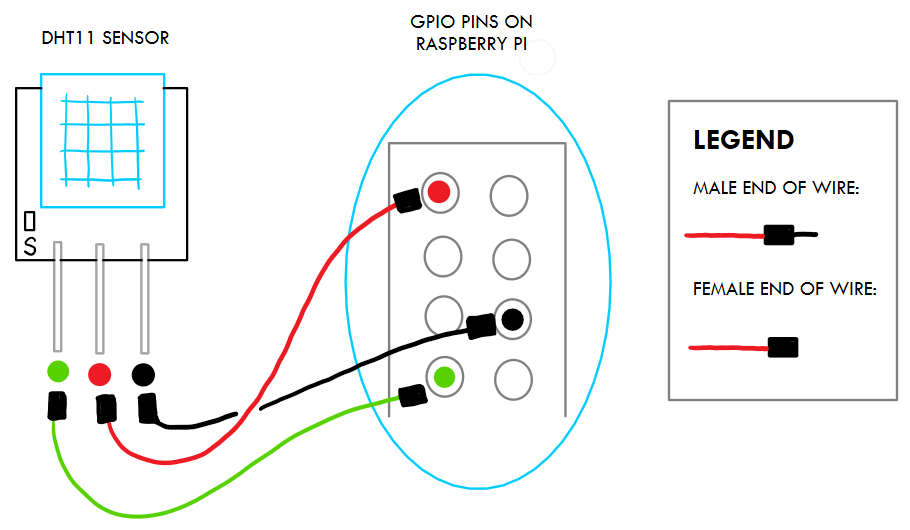
Method 1: (Easiest) Using three female-female wires
- Wire each sensor pin directly to its GPIO pin destination:
- Attach one female end of each wire to the pins on the sensor
- Attach the other female end of each wire to the correct GPIO pin on the Raspberry Pi
- You can use the two pinout sketches above to determine which pins should be connected to each other
- Your setup should look something like this:
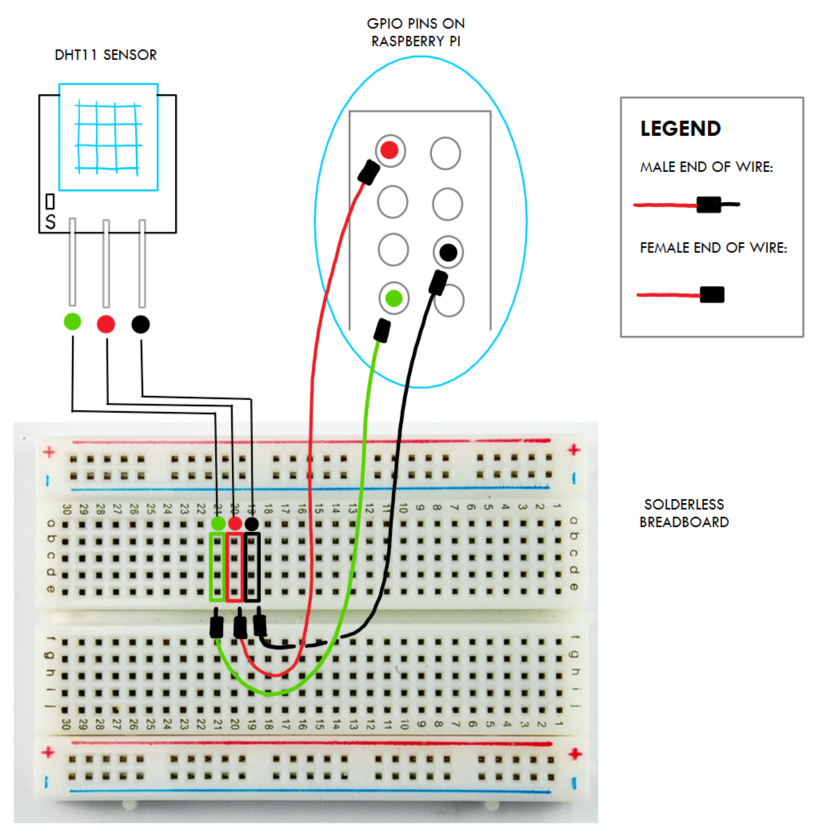
Method 2: Using three male-female wires
- Put the sensor into the solderless breadboard. It should be inserted into one of the lettered rows, such as the “a” row
- Put the male end of each wire into the breadboard. Keep in mind:
- Each sensor pin is connected to all of the breadboard holes in the same column (numbered on the breadboard) on that side of the breadboard
- In other words, you can plug the wire in anywhere inside the coloured box shown on the breadboard in the sketch below
- You may need to stagger the wires on the breadboard; plug them in so that they are in the correct (numbered) column but are not in the same (lettered) row
- Attach the female end of each wire to the correct GPIO pin on the Raspberry Pi
- Your setup should look something like this:
Step 4: Gather the test code:
Gather the test code from the reference below, under “Temperature & Humidity Sensor (DHT11)”
Find the test code in the Seeed Studio grove.py documentation:https://github.com/Seeed-Studio/grove.py/blob/master/doc/README.md
Modify the code slightly so that it matches the code below:
# Based on code from "Temperature & Humidity Sensor (DHT11)" section here: https://github.com/Seeed-Studio/grove.py/blob/master/doc/README.md

import time
from seeed_dht import DHT

dht11 = DHT("11", 4) # Type, GPIO pin for signal cable

while True:
    humi, temp = dht11.read()
    print('DHT{0}, humidity {1:.1f}%, temperature {2:.1f}*'.format(dht11.dht_type, humi, temp))
    # print(f"Temp: {temp}")
    time.sleep(1)
- Use Secure Copy (SCP) to copy it into the “Code” folder on the Raspberry Pi
Step 5: Run the test code:
- Turn your Raspberry Pi on
- Connect to the Raspberry Pi via SSH
- Navigate to the “Code” folder using cd Code in the terminal
- Run the test code by typing python3 filename.py into the terminal
Your DHT11 is successfully connected if it gives you non-zero values for temperature and humidity.
Sensor Accuracy:
The DHT11 can only give values with an accuracy of zero decimal places. You may notice that the test code prints values that end in “.0” - this is because the data has been formatted.
Phase 3: Making Sense of the Data
You will need:
- A computer
- The Raspberry Pi 4 Setup with DHT11 and DHT20 Sensors (from Phase 2)
Estimated Time Required: 3 Hours
3.1: Installing Extra Libraries
The code for Phase 3 will require us to install some extra libraries: Pandas, which will allow us to easily store the data in different forms, and Matplotlib, which will allow us to create graphs of the data. Follow the steps below:
Step 1: Connect to the Raspberry Pi via SSH.
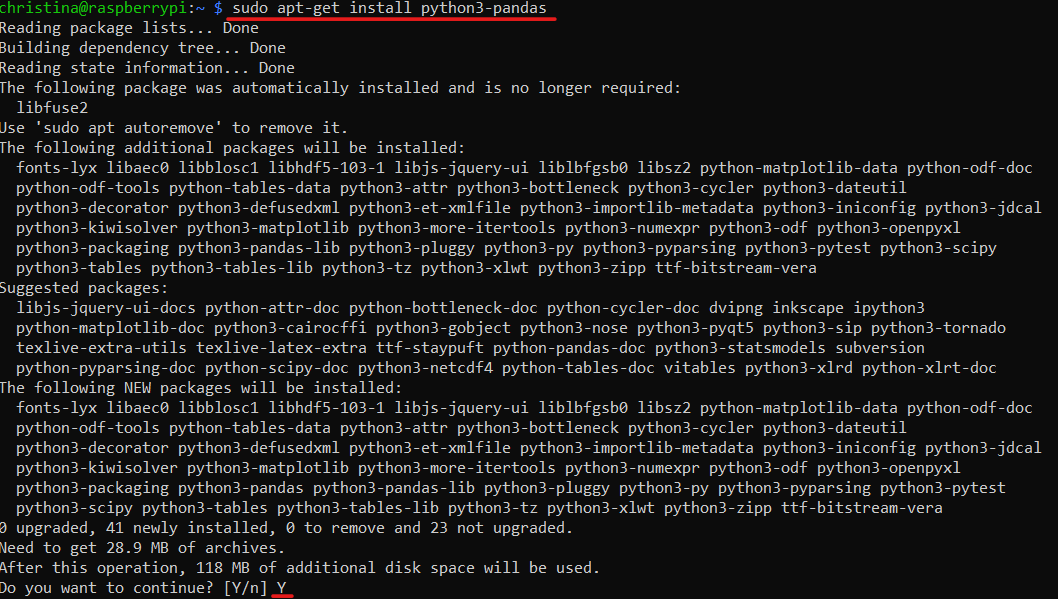
Step 2: Install Pandas by typing sudo apt-get install python3-pandas into the Terminal and hitting Enter. If a message appears about disk space and it asks you if you want to continue, type Y for "Yes" and hit Enter.
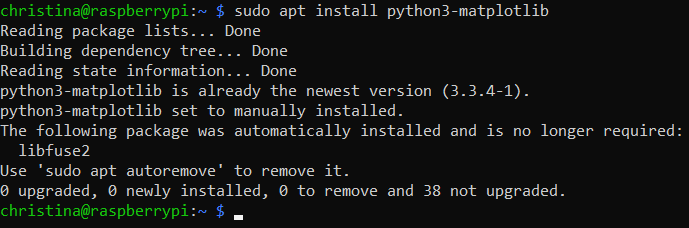
Step 3: Install Matplotlib by typing sudo apt install python3-matplotlib into the Terminal and hitting Enter.
We will also use the Time and Datetime libraries, but these come built-in and we don’t need to install them.
3.2: Writing the Data Collection Code
Now, we need to write the code that will collect the temperature and humidity data. I called my script “T_H_data_collector”.
I’m a big fan of laying out what I want a script to do before I start writing it. Here is what the code should do:
- Gather data from the DHT11 sensor
- Gather data from the DHT20 sensor
- Store all data in a CSV file
- CSV file should be added to when new data is gathered and not overwrite old data
- Generate an exception if a sensor is not responding
To allow us to see the data in real time as the code runs, it would also be a good idea to:
- Print each line of data to the terminal when it is collected
In essence, I combined the previous scripts used to test each sensor and then added the exception handling and data storage code. Here’s my code, but you should try to generate a similar result on your own:
# Current Version: v2-3, June 19, 2022
# References:
    # DHT11 data collection code is from grove.py documentation: https://github.com/Seeed-Studio/grove.py/blob/master/doc/README.md
    # DHT20 data collection code is from user ultracold on StackExchange: https://raspberrypi.stackexchange.com/questions/133457/how-can-rpi4b-use-python-to-talk-to-the-i2c-dht20-sht20-temperature-and-humidi
# Instructions:
    # Run via Raspberry Pi terminal using command: python3 T_H_data_collector_v1.py
    # Stop code using Ctrl + C or Command + C

# Changes from v2-2:
# - Added an if-else statement so that the header of the DataFrame is not written to the CSV file every single time
# - Removed import of csv library (no longer needed)

import time
import pandas as pd
from datetime import datetime, date
import smbus
from seeed_dht import DHT
import os.path

# Exception class will stop the code if we cannot connect to either sensor

class ConnectionError(Exception):
  """Exception raised when a sensor is not connected or responding to test code."""
  pass

# Using a function to write each line of the CSV file containing temperature and humidity data

def write_line():
    """
    Write a line of data to a CSV file. Data is collected by one DHT11 and one DHT20 temperature and humidity sensor.
    Each line contains: current date, current time, dht11_temp, dht11_humi, dht20_temp, dht20_humi.
    - Arguments: None
    - Returns: None
    """

    # Let's get data from the DHT11 sensor

    dht11 = DHT("11", 4) # Type, GPIO pin for signal cable

    # Make sure DHT11 can connect. If not, raise ConnectionError

    try:
        dht11_humi, dht11_temp = dht11.read()
    except:
        raise ConnectionError("DHT11 Sensor is not responding. Please check connection.")


    # Let's get data from the DHT20 sensor

    address = 0x38 # Put your device's address here

    i2cbus = smbus.SMBus(1)
    time.sleep(0.5)

    # Check that I2C connection was initialized. If not, raise ConncectionError

    data = i2cbus.read_i2c_block_data(address,0x71,1)
    if (data[0] | 0x08) == 0:
        raise ConnectionError("Initialization Error. Please check connection.")

    i2cbus.write_i2c_block_data(address,0xac,[0x33,0x00])
    time.sleep(0.1)

    # Make sure DHT20 can connect. If not, raise ConnectionError

    try:
        data = i2cbus.read_i2c_block_data(address,0x71,7)
    except:
        raise ConnectionError("DHT20 Sensor is not responding. Please check connection.")

    # Format the DHT20 data so it makes sense to us

    Traw = ((data[3] & 0xf) << 16) + (data[4] << 8) + data[5]
    dht20_temp = 200*float(Traw)/2**20 - 50

    Hraw = ((data[3] & 0xf0) >> 4) + (data[1] << 12) + (data[2] << 4)
    dht20_humi = 100*float(Hraw)/2**20

    # list of date, time --> Need to be converted into list format

    dates = []
    dates.append(date.today())

    times = []
    times.append(datetime.now().strftime("%H:%M:%S"))

    # Save the dictionary of lists into a Pandas DataFrame

    dict = {"Date": dates, "Time": times, "DHT11 Temp": dht11_temp, "DHT11 Humi": dht11_humi, "DHT20 Temp": dht20_temp, "DHT20 Humi": dht20_humi}
    df = pd.DataFrame(dict)

    # Print current line of data to the terminal

    print(df.iloc[0])

    # Write data to CSV file.
    # If the file already exists, append to the file without the header "Date, Time, DHT11 Temp, ...".
    # If the file does not already exist, a new file will be created and the header "Date, Time, DHT11 Temp, ..." will be written to the file along with the data.

    if os.path.exists("DHT_data.csv"):
        with open("DHT_data.csv", "a", newline="") as file:     # "a" ensures you append to the CSV, not overwrite it
            df.to_csv(file, index=False, header=False)
    else:
        with open("DHT_data.csv", "a", newline="") as file:
            df.to_csv(file, index=False)


if __name__ == "__main__":
    while True:
        write_line()
I had to try several different versions of the code to get the result I wanted. The general procedure of how I collected the data is:
Get data from sensors
Format data as needed
Store data in a list (of length 1)
Combine all lists into a dictionary containing the Date, Time, DHT11 Temp, DHT11 Humi, DHT20 Temp, and DHT20 Humi for that instant. There is only one data point per category.
Write the data to the CSV file “DHT_data.csv”:
If the file already exists, append to the file without the header "Date, Time, DHT11 Temp, DHT11 Humi, DHT20 Temp, DHT20 Humi".
If the file does not already exist, a new file will be created and the header "Date, Time, DHT11 Temp, ..." will be written to the file along with the data.
Try It Yourself:
Try to make the code above more efficient or simpler; there are many different ways to write data to a CSV file, and the method used above could be improved.
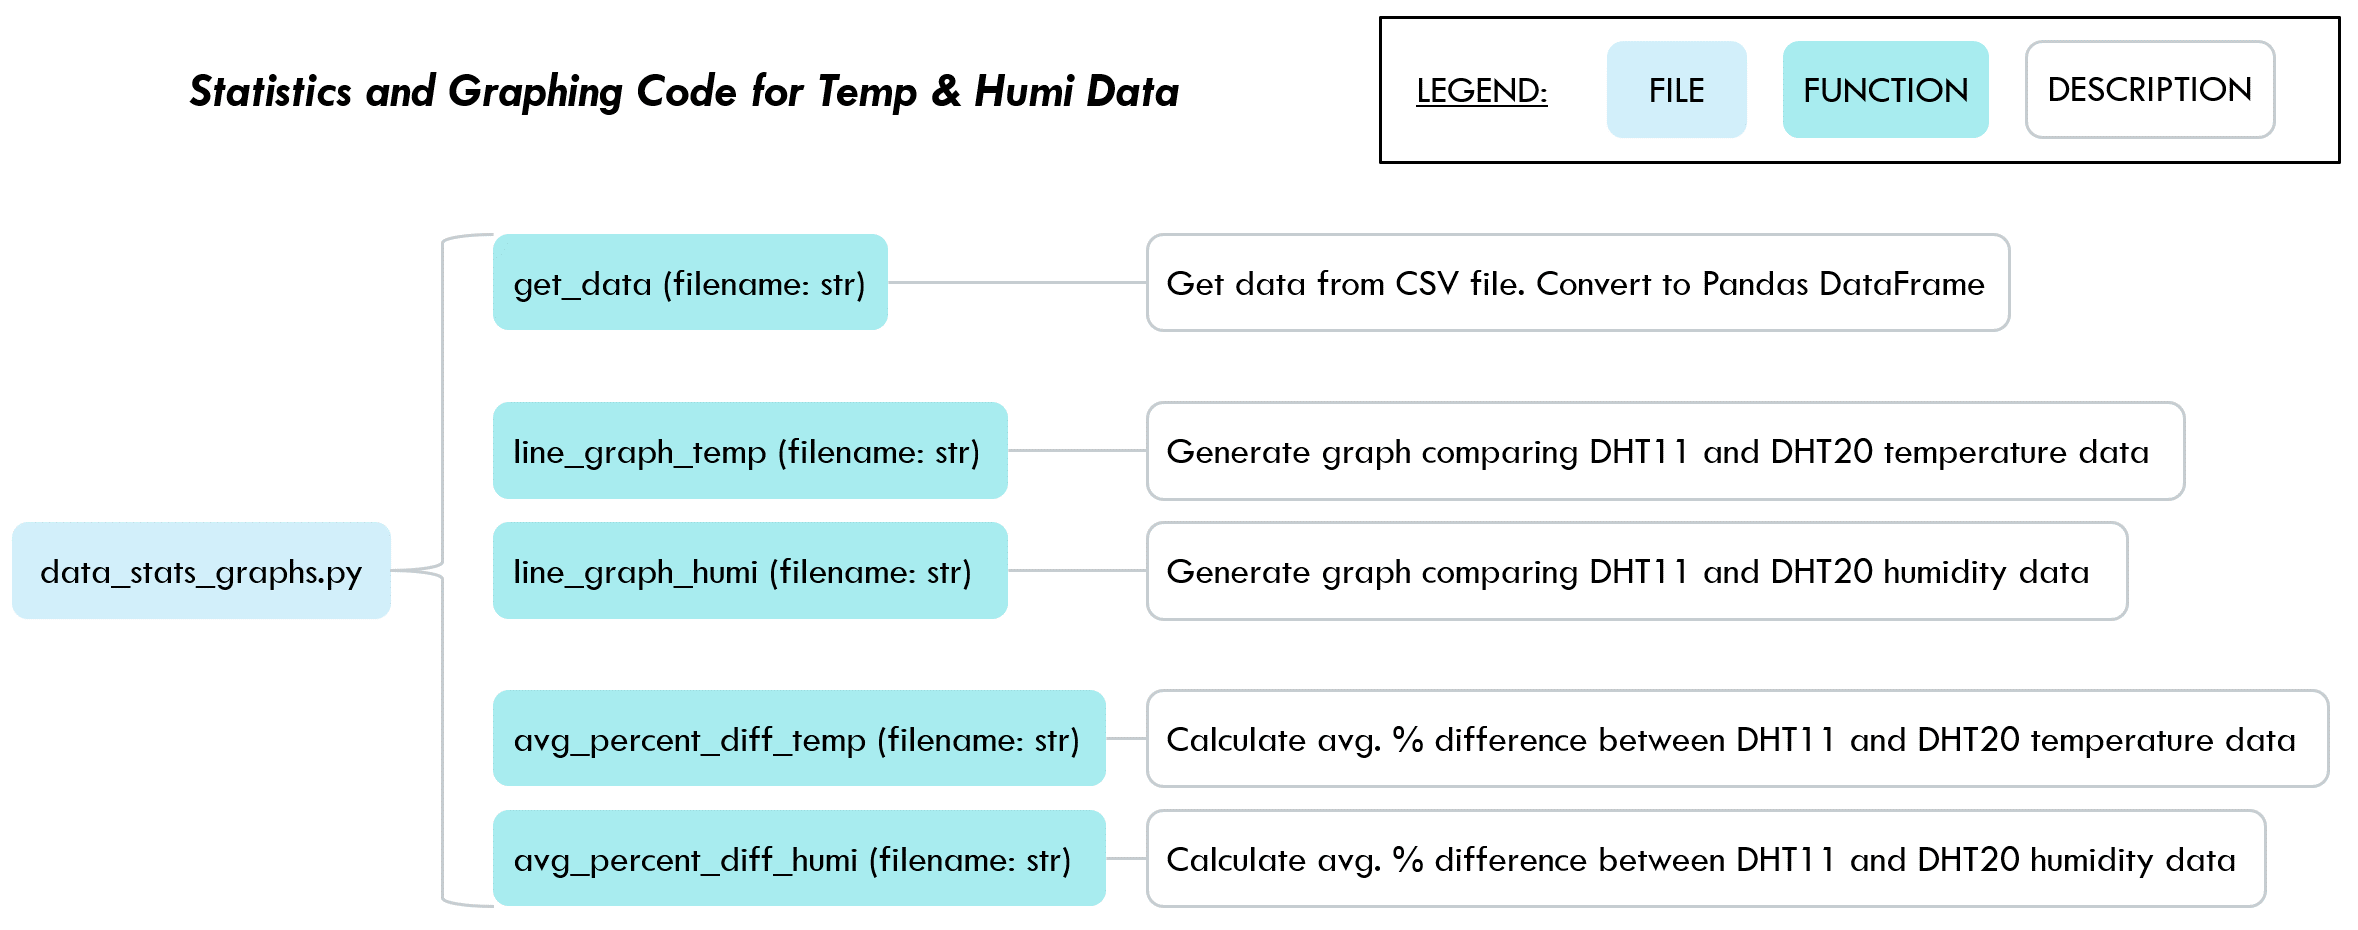
3.3: Writing the Statistics and Graphing Code
In another file, I wrote the code used to process the data and represent it in a meaningful way. I called this file “data_stats_graphs.py”. Whenever I needed to import this code into another file, I used the line import data_stats_graphs as dsg.
The code achieves two main goals:
Graph the data: Graph the values collected by both sensors and shade in the difference between these values. Create two graphs – one for temperature and one for humidity – and save each as a PNG file.
Give a meaningful statistic on the data: Calculate the average percent difference between the values from two sensors for both temperature and humidity data.
The overall structure of the code is explained in this infographic:
Here is the code:
# FINAL VERSION -- Currently in Use on R.Pi (June 20, 2022)

import matplotlib.pyplot as plt
import pandas as pd

def get_data(filename: str):
    """
    Gather all data from the CSV file containing DHT11 and DHT20 temperature and humidity data. Sort data into lists.

    Arguments:
    - filename: (str) Name of CSV file containing DHT11 and DHT20 data

    Returns:
    - labels: (list of strings) List containing date, time information of the form "Date, Time"
    - dht11_temp: (list of floats) List containing DHT11 temperature data
    - dht11_humi: (list of floats) List containing DHT11 humidity data
    - dht20_temp: (list of floats) List containing DHT20 temperature data
    - dht20_humi: (list of floats) List containing DHT20 humidity data
    """

    # Set up all data as lists

    df = pd.read_csv(filename)

    datelabels = df.iloc[:,0]
    timelabels = df.iloc[:,1]


    # Get labels for the x-axis of the graphs; has the form "Date, Time"

    labels = []

    for i in range(len(datelabels)):
        labels.append(f"{datelabels[i]}, {timelabels[i]}")


    # Get lists for temperature data

    dht11_temp = pd.DataFrame(df.iloc[:,2])
    dht20_temp = pd.DataFrame(df.iloc[:,4])

    # Get lists for humidity data

    dht11_humi = pd.DataFrame(df.iloc[:,3])
    dht20_humi = pd.DataFrame(df.iloc[:,5])

    return labels, dht11_temp, dht11_humi, dht20_temp, dht20_humi

def line_graph_temp(filename: str):
    """
    Generates a PNG image of a Matplotlib graph for the DHT11 and DHT20 temperature data. Graph is a scatterplot with lines connecting discrete data points. Region between sets of data is shaded.

    Arguments:
    - filename: (str) Name of CSV file containing data

    Returns: None
    """


    # Get all date-time labels and temp, humi data

    labels, dht11_temp, dht11_humi, dht20_temp, dht20_humi = get_data(filename)

    # Convert DataFrames to List format

    dht11_temp_list = list(dht11_temp.iloc[:,0])
    dht11_humi_list = list(dht11_humi.iloc[:,0])
    dht20_temp_list = list(dht20_temp.iloc[:,0])
    dht20_humi_list = list(dht20_humi.iloc[:,0])

    # Create figure object

    fig1 = plt.figure()


    # Plot as a continuous line with dots at each data point

    plt.plot(labels, dht11_temp_list, '-o', label='DHT11 Sensor', color='dodgerblue')
    plt.plot(labels, dht20_temp_list, '-o', label='DHT20 Sensor', color='red')


    # Fill between the curves

    plt.fill_between(labels, dht11_temp_list, dht20_temp_list, color='thistle')


    # Set axis labels, title and legend

    plt.xlabel('Date, Time Recorded')
    plt.ylabel('Temperature (Degrees Celsius)')
    plt.title('Comparing Temperature Readings of Two Electronic Sensors')
    plt.legend()


    # Rotate text on x-axis

    plt.xticks(rotation = 90)


    # Save as PNG

    fig1.savefig('static/line_graph_temp.png', bbox_inches='tight')

def line_graph_humi(filename: str):
    """
    Generates a PNG image of a Matplotlib graph for the DHT11 and DHT20 humidity data. Graph is a scatterplot with lines connecting discrete data points. Region between sets of data is shaded.

    Arguments:
    - filename: (str) Name of CSV file containing data

    Returns: None
    """


    # Get all date-time labels and temp, humi data

    labels, dht11_temp, dht11_humi, dht20_temp, dht20_humi = get_data(filename)

    # Convert DataFrames to List format

    dht11_temp_list = list(dht11_temp.iloc[:,0])
    dht11_humi_list = list(dht11_humi.iloc[:,0])
    dht20_temp_list = list(dht20_temp.iloc[:,0])
    dht20_humi_list = list(dht20_humi.iloc[:,0])

    # Create figure object

    fig2 = plt.figure()


    # Plot as a continuous line with dots at each data point

    plt.plot(labels, dht11_humi_list, '-o', label='DHT11 Sensor', color='dodgerblue')
    plt.plot(labels, dht20_humi_list, '-o', label='DHT20 Sensor', color='red')


    # Fill between the curves

    plt.fill_between(labels, dht11_humi_list, dht20_humi_list, color='thistle')


    # Set axis labels, title and legend

    plt.xlabel('Date, Time Recorded')
    plt.ylabel('Relative Humidity (%)')
    plt.title('Comparing Relative Humidity Readings of Two Electronic Sensors')
    plt.legend()


    # Rotate text on x-axis

    plt.xticks(rotation = 90)


    # Save as PNG

    fig2.savefig('static/line_graph_humi.png', bbox_inches='tight')

def avg_percent_diff_temp(filename:str):
    """
    Finds the average percent difference between all DHT11 and DHT20 temperature data.

    Arguments:
    - filename: (str) Name of CSV file containing data

    Returns:
    - average: (float) Average percent difference between all DHT11 and DHT20 temperature data
    - avg_statement: (str) String containing statement about calculated average, for display purposes
    """

    # Get all date-time labels and temp, humi data

    labels, dht11_temp, dht11_humi, dht20_temp, dht20_humi = get_data(filename)


    # Calculate the percent difference between each data point

    rects = []

    for i in range(len(dht11_temp)):
        calc = (abs(float(dht11_temp.iloc[i,0]) - float(dht20_temp.iloc[i,0]))) / ((float(dht11_temp.iloc[i,0]) + float(dht20_temp.iloc[i,0])) / 2) * 100
        rects.append(calc)


    # Find average of all percent differences and round to 3 decimal places

    average = round((sum(rects) / len(rects)), 3)

    # Create an easy-to-print statement summarizing the result

    # avg_statement = f"Average Percent Difference Between DHT11 and DHT20 Sensors (Temperature): {average}%"

    return average

def avg_percent_diff_humi(filename:str):
    """
    Finds the average percent difference between all DHT11 and DHT20 humidity data.

    Arguments:
    - filename: (str) Name of CSV file containing data

    Returns:
    - average: (float) Average percent difference between all DHT11 and DHT20 humidity data
    - avg_statement: (str) String containing statement about calculated average, for display purposes
    """

    # Get all date-time labels and temp, humi data

    labels, dht11_temp, dht11_humi, dht20_temp, dht20_humi = get_data(filename)


    # Calculate the percent difference between each data point

    rects = []

    for i in range(len(dht11_humi)):
        calc = (abs(float(dht11_humi.iloc[i,0]) - float(dht20_humi.iloc[i,0]))) / ((float(dht11_humi.iloc[i,0]) + float(dht20_humi.iloc[i,0])) / 2) * 100
        rects.append(calc)


    # Find average of all percent differences and round to 3 decimal places

    average = round((sum(rects) / len(rects)), 3)

    # Create an easy-to-print statement summarizing the result

    # avg_statement = f"Average Percent Difference Between DHT11 and DHT20 Sensors (Temperature): {average}%"

    return average

filename = "DHT_data.csv"
Observations:
- The data used in this code is stored in several Pandas DataFrames. However, you need to convert the data to list format for the graphing functions because the data needs to be one-dimensional.
- Pandas.DataFrame.iloc was a very useful tool for selecting specific rows or columns of Pandas DataFrame data. See the documentation for more details: https://pandas.pydata.org/docs/reference/api/pandas.DataFrame.iloc.html
Phase 4: Putting it All Together
We have finally reached the part of this project where we can see our work and share it with others! This involves implementing a web application that we can use to show our new statistics and graphs over a network.
A web application is an application software (i.e. Gmail, Google Docs, Microsoft Office 365, etc.) that runs on a network (for example, your Wi-Fi network at home).
This is also sometimes called a web server, which is a different, but related, concept. Web servers can accept and fulfill HTTP GET and POST requests while also representing static data. Static data might be images, files, or text – generally things that don’t regularly change.
Web applications are a way to represent both static and dynamic data. Dynamic data changes over time, and the web app can be used to reflect these changes in real time.
For the purpose of this section, we will use “web application” and “web server” interchangeably.
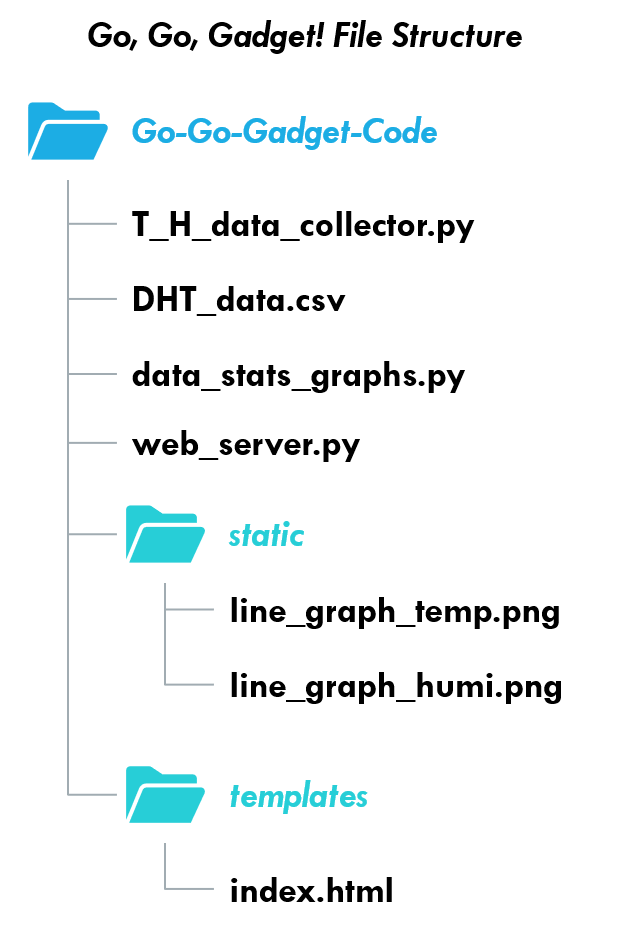
4.1: Structure of Files
It is important to use the organization of files as shown below. The functions of many of these files will be explained in the remainder of Phase 4.
4.2: Installing Flask
We will use the Flask library to implement our web app. Flask may already be installed on the Raspberry Pi, but we need to be sure. Follow the steps below:
Connect to the Raspberry Pi via SSH.
In the Terminal, type sudo pip3 install flask and hit Enter.
If Flask was already installed, the Raspberry Pi will tell you so.
4.3: Setting Up the Flask App
I wrote my web application in a file called “web_server.py”. You can use this code (below) as a starting point:
from flask import Flask, render_template
import data_stats_graphs as dsg

app = Flask(__name__)

# Static Route:
# if someone requests the root route, execute the following (i.e. what the page shows when nothing or / is typed in the address bar after localhost:5000)

@app.route("/")

def index():

    # Generate PNG Graphs for the Data
    dsg.line_graph_temp(dsg.filename)
    dsg.line_graph_humi(dsg.filename)

    # Template Method:
    return render_template('index.html', t_avg_percent_diff=dsg.avg_percent_diff_temp(dsg.filename), h_avg_percent_diff=dsg.avg_percent_diff_humi(dsg.filename))    # Have the HTML code ready as a template and ask flask to read it back to the user
                                            # Templates separate the HTML from the logic and allow you to easily adjust content


if __name__ == "__main__":
    app.debug = True    # When we run the server, will run debug mode. Will automatically relaunch server when we change the code!
    app.run(host="0.0.0.0")     # Tells web server to listen on all network interfaces. Allows web server to be viewed by other devices on the same network.
Here is a quick breakdown of what is happening, in case you aren’t familiar with Flask apps:
app = Flask(__name__)
Initializing the Flask app.
@app.route("/")

def index(): ...
The default (root) route for the web server. When you access the web server using http://[IP Address]:[Port #] or http://[IP Address]:[Port #]/, whatever page we put inside of the index() function will show up.
dsg.line_graph_temp(dsg.filename)
dsg.line_graph_humi(dsg.filename)
Create the PNG graphs of the data using the data_stats_graphs.py file we created in Phase 3. These PNGs will be saved to the destination we specified in each line_graph_temp() or line_graph_humi() function (the “static” folder).
    return render_template('index.html', t_avg_percent_diff=dsg.avg_percent_diff_temp(dsg.filename), h_avg_percent_diff=dsg.avg_percent_diff_humi(dsg.filename))    # Have the HTML code ready as a template and ask flask to read it back to the user
                                            # Templates separate the HTML from the logic and allow you to easily adjust content
This part looks more complicated than it is. If we only had return render_template('index.html'), this would load the HTML page onto the screen when the root route is accessed. All of the statements after this, like t_avg_percent_diff=dsg.avg_percent_diff_temp(dsg.filename) is just a way to load Python data into the HTML page. These lines are written in the form variable_name_in_HTML_page=python_variable.
if __name__ == "__main__":
    app.debug = True    # When we run the server, will run debug mode. Will automatically relaunch server when we change the code!
    app.run(host="0.0.0.0")     # Tells web server to listen on all network interfaces. Allows web server to be viewed by other devices on the same network.
Run the web server when we run the code. Also run debug mode, which will automatically reload the server when we make changes to the code. This lets us see changes without constantly killing the server and running it again.
We also choose the “host” to be “0.0.0.0”. This tells the web server to listen on all network interfaces, so if we run this code on the Raspberry Pi and then type http://[IP Address of Raspberry Pi]:5000 into the URL bar of a browser (Chrome, Microsoft Edge, Firefox, etc.) of a different computer on the same network, our web server will show up.
If we didn’t include the “host” and instead used the line app.run(), the web server would only be available locally. This means that it could only be accessed on the same computer running the code. It would show up under the IP address 127.0.0.1, which allows the computer to connect and communicate with itself. This is also known as localhost, and we would need to type http://localhost:5000 into the URL of a browser to see the web server.
You may be wondering what the “5000” is. This is the default port number – a computer networking endpoint. You can change the port number if you like; instructions can be found in the Flask documentation.
If this seems confusing, I like to think of the IP addresses and port numbers this way: The IP address is like the name of your street and the port number is like your house number. If someone wanted to go to your house, they would need both to find it. So if one computer wants to “talk” to another, it needs both the IP address of the other computer and the port number to use. It’s not a perfect analogy, but it helped me understand concepts that can seem very abstract.
4.4: Creating the HTML Page
The HTML page is what will be displayed when we access the web app, and we will use HTML code to make this happen. I did this in a file called “index.html”, which is loaded into the web app using the return render_template(…) line from web_server.py. The code is found below:
<!-- Author: Christina Kampel -->
<!DOCTYPE html>
<html>
<head>
    <title>Go, Go, Gadget!</title>
    <!-- Information we want to show on the App Tab -->
    <style>
        .column{
            width:50%;
            float:left;
        }
        .row::after{
            content: "";
            clear: both;
            display: table;
        }
    </style>
</head>


<body>
    <h1>Go, Go, Gadget!</h1>
    <h2>Raspberry Pi Weather Stations for the Absolute Beginner</h2>
    <p>Christina Kampel<br>
        Digital Engineering Fellowship<br>
        University of Calgary<br>
        Spring 2022<br>
    </p>

    <div class="row">
        <div class="column">
            <img src="/static/line_graph_temp.png" alt="Line Graph of Temperature Data" style="float:left; width:100%">
        </div>
        <div class="column">
            <img src="/static/line_graph_humi.png" alt="Line Graph of Relative Humidity Data" style="float:left; width:100%">
        </div>
    </div>

    <p>
        Average Percent Difference Between DHT11 and DHT20 Sensors (Temperature): <b>{{ t_avg_percent_diff }}</b>%<br>
        Average Percent Difference Between DHT11 and DHT20 Sensors (Relative Humidity)): <b>{{ h_avg_percent_diff }}</b>%<br>
    </p>

</body>
</html>
Some key points to note:
The content within the
<title>tag appears on the tab of the browser you are using to view the page.The content within the
<style>tag is used to format the two graphs on the same line, side-by-side. Without this content, the images appear one after the other on two separate lines.The content within the
<style>tag is written in CSS (Cascading Style Sheet) format. CSS files are often a separate file that is linked within the HTML file and used to format the HTML page (layouts, colours, fonts, etc.). More information about CSS files is available online.
Now that we have completed all of our project goals, make sure you Secure Copy the files onto the Raspberry Pi and organize them in the structure shown in 4.1. You are now ready to use your Raspberry Pi Weather Station!
4.5: Running the Raspberry Pi Weather Station
To show off all your hard work, follow the steps below!
Ensure your personal computer and the Raspberry Pi are on the same network.
Connect to the Raspberry Pi via SSH.
If needed, gather data from your DHT11 and DHT20 sensors, run the T_H_data_collector.py file on the Raspberry Pi. The Raspberry Pi should be connected to both sensors.
Start the web application by running the web_server.py file on the Raspberry Pi.
View the web application by opening a web browser on your personal computer and typing http://[IP Address of Raspberry Pi]:5000/ into the address bar. The web page, graphs, and statistics will appear!
Thank You For Reading!
I hope you enjoyed this project as much as I did. If you are curious about other projects you can try with a Raspberry Pi, I highly recommend reading the inspiration for this project: Creative Projects with Raspberry Pi by Kirsten Kearney and Will Freeman (ISBN: 978-1-4197-2500-5).
Image Sources
Raspberry Pi 4 Model B Image: https://www.raspberrypi.com/products/raspberry-pi-4-model-b/
Grove Base HAT Pinout: https://wiki.seeedstudio.com/Grove_Base_Hat_for_Raspberry_Pi/
DHT11 Image: https://components101.com/sensors/dht11-temperature-sensor